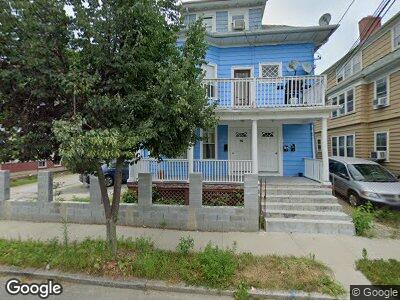
93 Moore St Providence, RI 02907
Elmwood NeighborhoodEstimated Value: $390,310 - $698,000
8
Beds
3
Baths
3,628
Sq Ft
$159/Sq Ft
Est. Value
About This Home
This home is located at 93 Moore St, Providence, RI 02907 and is currently estimated at $576,078, approximately $158 per square foot. 93 Moore St is a home located in Providence County with nearby schools including Asa Messer Elementary School, Charles N. Fortes Elementary School, and Alfred Lima Sr. Elementary School.
Ownership History
Date
Name
Owned For
Owner Type
Purchase Details
Closed on
Jun 7, 2012
Sold by
Murphy William H
Bought by
Pimental Pablo and Pimental Laura
Current Estimated Value
Home Financials for this Owner
Home Financials are based on the most recent Mortgage that was taken out on this home.
Original Mortgage
$155,944
Outstanding Balance
$111,086
Interest Rate
3.75%
Mortgage Type
FHA
Estimated Equity
$415,361
Purchase Details
Closed on
Sep 2, 2011
Sold by
Mena Francisco A and Structured Asset Secur
Bought by
Structured Asset Secur and Us Bank Na Tr
Purchase Details
Closed on
Aug 20, 2010
Sold by
Mena Francisco
Bought by
Equity Growth
Purchase Details
Closed on
Dec 4, 2007
Sold by
Mena Francisco Alber and Narragansett Bay Comm
Bought by
Mena Francisco Alber
Purchase Details
Closed on
Oct 17, 2007
Sold by
Mena Francisco Alber and Narragansett Bay Cmnty
Bought by
Rhode Island Hsng & Mtg
Create a Home Valuation Report for This Property
The Home Valuation Report is an in-depth analysis detailing your home's value as well as a comparison with similar homes in the area
Home Values in the Area
Average Home Value in this Area
Purchase History
| Date | Buyer | Sale Price | Title Company |
|---|---|---|---|
| Pimental Pablo | $160,000 | -- | |
| Structured Asset Secur | $121,500 | -- | |
| Equity Growth | $1,473 | -- | |
| Mena Francisco Alber | $2,844 | -- | |
| Rhode Island Hsng & Mtg | $2,194 | -- |
Source: Public Records
Mortgage History
| Date | Status | Borrower | Loan Amount |
|---|---|---|---|
| Open | Pimental Pablo | $155,944 | |
| Closed | Rhode Island Hsng & Mtg | $155,944 |
Source: Public Records
Tax History Compared to Growth
Tax History
| Year | Tax Paid | Tax Assessment Tax Assessment Total Assessment is a certain percentage of the fair market value that is determined by local assessors to be the total taxable value of land and additions on the property. | Land | Improvement |
|---|---|---|---|---|
| 2024 | $6,230 | $339,500 | $53,600 | $285,900 |
| 2023 | $6,230 | $339,500 | $53,600 | $285,900 |
| 2022 | $6,043 | $339,500 | $53,600 | $285,900 |
| 2021 | $5,430 | $221,100 | $40,100 | $181,000 |
| 2020 | $5,430 | $221,100 | $40,100 | $181,000 |
| 2019 | $5,430 | $221,100 | $40,100 | $181,000 |
| 2018 | $4,388 | $137,300 | $27,300 | $110,000 |
| 2017 | $4,388 | $137,300 | $27,300 | $110,000 |
| 2016 | $4,388 | $137,300 | $27,300 | $110,000 |
| 2015 | $3,972 | $120,000 | $33,400 | $86,600 |
| 2014 | $4,050 | $120,000 | $33,400 | $86,600 |
| 2013 | $4,050 | $120,000 | $33,400 | $86,600 |
Source: Public Records
Map
Nearby Homes