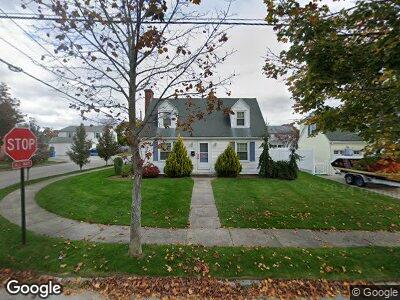
93 Roslyn Ave Cranston, RI 02910
Forest Hills NeighborhoodEstimated Value: $380,000 - $495,000
2
Beds
3
Baths
1,720
Sq Ft
$244/Sq Ft
Est. Value
About This Home
This home is located at 93 Roslyn Ave, Cranston, RI 02910 and is currently estimated at $418,989, approximately $243 per square foot. 93 Roslyn Ave is a home located in Providence County with nearby schools including Woodridge Elementary School, Western Hills Middle School, and Cranston High School West.
Ownership History
Date
Name
Owned For
Owner Type
Purchase Details
Closed on
Jun 21, 2024
Sold by
Hagopian John V
Bought by
Hagopian Firt and Hagopian H
Current Estimated Value
Purchase Details
Closed on
Dec 8, 2023
Sold by
Hagopian David J and Deangelis Kristen J
Bought by
Hagopian John V
Purchase Details
Closed on
Jan 12, 2000
Sold by
Perry Scott M and Perry Sheri
Bought by
Rossi Michael M
Home Financials for this Owner
Home Financials are based on the most recent Mortgage that was taken out on this home.
Original Mortgage
$113,957
Interest Rate
7.79%
Purchase Details
Closed on
Nov 30, 1995
Sold by
Ruginski Florence L
Bought by
Perry Scott M and Perry Sheri
Home Financials for this Owner
Home Financials are based on the most recent Mortgage that was taken out on this home.
Original Mortgage
$92,150
Interest Rate
7.37%
Create a Home Valuation Report for This Property
The Home Valuation Report is an in-depth analysis detailing your home's value as well as a comparison with similar homes in the area
Home Values in the Area
Average Home Value in this Area
Purchase History
| Date | Buyer | Sale Price | Title Company |
|---|---|---|---|
| Hagopian Firt | -- | None Available | |
| Hagopian Firt | -- | None Available | |
| Hagopian John V | -- | None Available | |
| Hagopian John V | -- | None Available | |
| Hagopian John V | -- | None Available | |
| Rossi Michael M | $115,000 | -- | |
| Perry Scott M | $97,000 | -- | |
| Rossi Michael M | $115,000 | -- | |
| Perry Scott M | $97,000 | -- |
Source: Public Records
Mortgage History
| Date | Status | Borrower | Loan Amount |
|---|---|---|---|
| Previous Owner | Perry Scott M | $143,000 | |
| Previous Owner | Perry Scott M | $113,957 | |
| Previous Owner | Perry Scott M | $92,150 |
Source: Public Records
Tax History Compared to Growth
Tax History
| Year | Tax Paid | Tax Assessment Tax Assessment Total Assessment is a certain percentage of the fair market value that is determined by local assessors to be the total taxable value of land and additions on the property. | Land | Improvement |
|---|---|---|---|---|
| 2024 | $4,421 | $324,800 | $103,600 | $221,200 |
| 2023 | $4,506 | $238,400 | $71,500 | $166,900 |
| 2022 | $4,413 | $238,400 | $71,500 | $166,900 |
| 2021 | $4,291 | $238,400 | $71,500 | $166,900 |
| 2020 | $4,220 | $203,200 | $74,900 | $128,300 |
| 2019 | $4,220 | $203,200 | $74,900 | $128,300 |
| 2018 | $4,123 | $203,200 | $74,900 | $128,300 |
| 2017 | $4,044 | $176,300 | $68,100 | $108,200 |
| 2016 | $3,958 | $176,300 | $68,100 | $108,200 |
| 2015 | $3,958 | $176,300 | $68,100 | $108,200 |
| 2014 | $3,696 | $161,800 | $68,100 | $93,700 |
Source: Public Records
Map
Nearby Homes