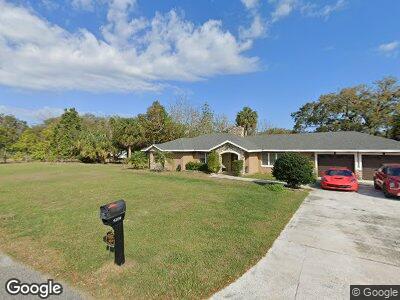
9325 Trout Lake Rd Orlando, FL 32818
Trout Lake Camp NeighborhoodEstimated Value: $339,000 - $445,000
2
Beds
2
Baths
1,588
Sq Ft
$249/Sq Ft
Est. Value
About This Home
This home is located at 9325 Trout Lake Rd, Orlando, FL 32818 and is currently estimated at $395,257, approximately $248 per square foot. 9325 Trout Lake Rd is a home located in Orange County with nearby schools including Prairie Lake Elementary School, Ocoee Middle School, and Wekiva High School.
Ownership History
Date
Name
Owned For
Owner Type
Purchase Details
Closed on
Sep 20, 2024
Sold by
Lewis Jordan Charles and Barajas Alondra
Bought by
Owg Trust and Alencar
Current Estimated Value
Home Financials for this Owner
Home Financials are based on the most recent Mortgage that was taken out on this home.
Original Mortgage
$133,229
Outstanding Balance
$132,740
Interest Rate
6.47%
Mortgage Type
Seller Take Back
Estimated Equity
$306,859
Purchase Details
Closed on
Dec 17, 2021
Sold by
Waidrop Michael E
Bought by
Lewis Jordan Charles and Barajas Alondra
Home Financials for this Owner
Home Financials are based on the most recent Mortgage that was taken out on this home.
Original Mortgage
$245,471
Interest Rate
3.09%
Mortgage Type
FHA
Purchase Details
Closed on
Feb 25, 2014
Sold by
Waldrop Michael E
Bought by
Tillman William A
Create a Home Valuation Report for This Property
The Home Valuation Report is an in-depth analysis detailing your home's value as well as a comparison with similar homes in the area
Home Values in the Area
Average Home Value in this Area
Purchase History
| Date | Buyer | Sale Price | Title Company |
|---|---|---|---|
| Owg Trust | $442,182 | Empora Title | |
| Lewis Jordan Charles | $250,000 | The Closing Agent Llc | |
| Tillman William A | $75,000 | None Available | |
| Waldrop Michael E | $75,000 | None Available |
Source: Public Records
Mortgage History
| Date | Status | Borrower | Loan Amount |
|---|---|---|---|
| Open | Owg Trust | $133,229 | |
| Open | Owg Trust | $233,152 | |
| Previous Owner | Lewis Jordan Charles | $245,471 |
Source: Public Records
Tax History Compared to Growth
Tax History
| Year | Tax Paid | Tax Assessment Tax Assessment Total Assessment is a certain percentage of the fair market value that is determined by local assessors to be the total taxable value of land and additions on the property. | Land | Improvement |
|---|---|---|---|---|
| 2024 | $1,007 | $100,945 | -- | -- |
| 2023 | $1,007 | $85,984 | $45,000 | $40,984 |
| 2022 | $1,269 | $65,024 | $30,000 | $35,024 |
| 2021 | $720 | $61,143 | $30,000 | $31,143 |
| 2020 | $728 | $66,773 | $30,000 | $36,773 |
| 2019 | $764 | $68,181 | $0 | $0 |
| 2018 | $764 | $66,910 | $25,000 | $41,910 |
| 2017 | $765 | $67,398 | $25,000 | $42,398 |
| 2016 | $760 | $67,654 | $25,000 | $42,654 |
| 2015 | $774 | $66,986 | $25,000 | $41,986 |
| 2014 | $676 | $66,259 | $29,450 | $36,809 |
Source: Public Records
Map
Nearby Homes
- 0 Trout Lake Rd
- 3065 Timber Hawk Cir
- 3033 Timber Hawk Cir
- 2950 Timber Hawk Cir
- 2837 Darlington Oak Ln
- 1838 Palmerston Cir
- 1757 Brush Cherry Place
- 2136 Laurel Blossom Cir
- 2045 El Marra Dr
- 2949 Muller Oak Loop
- 2825 Muller Oak Loop
- 1485 Whitefriar Dr
- 2521 Laurel Blossom Cir
- 3422 Briarwood Grove Dr
- 2614 Grapevine Crest
- 3449 Briarwood Grove Dr
- 1918 Arden Oaks Dr
- 1511 Orange Valley Ridge
- 2732 Norway Maple Ct
- 3632 Gretchen Dr