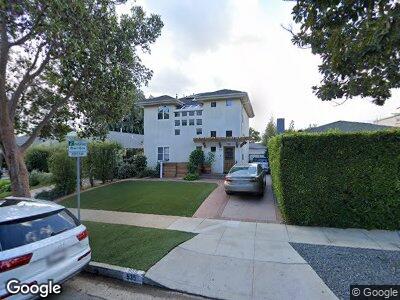
935 Fiske St Pacific Palisades, CA 90272
Pacific Palisades NeighborhoodEstimated Value: $2,754,054 - $4,049,000
3
Beds
2
Baths
1,910
Sq Ft
$1,751/Sq Ft
Est. Value
About This Home
This home is located at 935 Fiske St, Pacific Palisades, CA 90272 and is currently estimated at $3,344,351, approximately $1,750 per square foot. 935 Fiske St is a home located in Los Angeles County with nearby schools including Palisades Charter Elementary, Marquez Charter School, and Paul Revere Charter Middle School.
Ownership History
Date
Name
Owned For
Owner Type
Purchase Details
Closed on
Aug 12, 2024
Sold by
Busch/Tanegashima Family Trust and Tanegashima Kaori
Bought by
Busch/Tanegashima Family Trust and Tanegashima
Current Estimated Value
Purchase Details
Closed on
Jul 29, 2024
Sold by
Busch Joel H
Bought by
Busch/Tanegashima Family Trust and Tanegashima
Purchase Details
Closed on
Sep 20, 2001
Sold by
Busch Joel H
Bought by
Busch Joel H and Tanegashima Kaori
Home Financials for this Owner
Home Financials are based on the most recent Mortgage that was taken out on this home.
Original Mortgage
$103,600
Interest Rate
6.99%
Purchase Details
Closed on
Sep 19, 2001
Sold by
Busch Joel H
Bought by
Busch Joel H and Tanegashima Kaori
Home Financials for this Owner
Home Financials are based on the most recent Mortgage that was taken out on this home.
Original Mortgage
$103,600
Interest Rate
6.99%
Purchase Details
Closed on
Jun 1, 2000
Sold by
Busch Joel H
Bought by
Busch Joel H and Tanegashima Kaori
Create a Home Valuation Report for This Property
The Home Valuation Report is an in-depth analysis detailing your home's value as well as a comparison with similar homes in the area
Home Values in the Area
Average Home Value in this Area
Purchase History
| Date | Buyer | Sale Price | Title Company |
|---|---|---|---|
| Busch/Tanegashima Family Trust | -- | None Listed On Document | |
| Busch Joel H | -- | -- | |
| Busch Joel H | -- | Old Republic Title Company | |
| Busch Joel H | -- | -- |
Source: Public Records
Mortgage History
| Date | Status | Borrower | Loan Amount |
|---|---|---|---|
| Previous Owner | Busch Joel H | $103,600 |
Source: Public Records
Tax History Compared to Growth
Tax History
| Year | Tax Paid | Tax Assessment Tax Assessment Total Assessment is a certain percentage of the fair market value that is determined by local assessors to be the total taxable value of land and additions on the property. | Land | Improvement |
|---|---|---|---|---|
| 2024 | $3,147 | $245,146 | $76,888 | $168,258 |
| 2023 | $3,092 | $240,340 | $75,381 | $164,959 |
| 2022 | $2,957 | $235,628 | $73,903 | $161,725 |
| 2021 | $2,907 | $231,008 | $72,454 | $158,554 |
| 2019 | $2,822 | $224,158 | $70,306 | $153,852 |
| 2018 | $2,734 | $219,764 | $68,928 | $150,836 |
| 2016 | $2,595 | $211,232 | $66,252 | $144,980 |
| 2015 | $2,557 | $208,060 | $65,257 | $142,803 |
| 2014 | $2,574 | $203,985 | $63,979 | $140,006 |
Source: Public Records
Map
Nearby Homes
- 930 Embury St
- 947 Galloway St
- 911 Galloway St
- 1031 Fiske St
- 1022 Galloway St
- 1011 Hartzell St
- 930 Hartzell St
- 830 Fiske St
- 863 Toyopa Dr
- 1051 Hartzell St
- 946 Iliff St
- 811 Galloway St
- 839 Toyopa Dr
- 1101 Hartzell St
- 1107 Hartzell St
- 1116 Galloway St
- 1017 Kagawa St
- 1106 Hartzell St
- 1027 Kagawa St
- 811 Iliff St