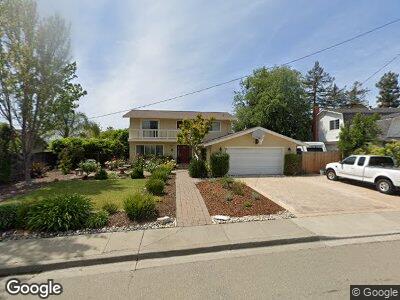
9417 Cherry Hills Ln San Ramon, CA 94583
San Ramon Valley NeighborhoodEstimated Value: $1,655,294 - $1,807,000
4
Beds
3
Baths
2,040
Sq Ft
$851/Sq Ft
Est. Value
About This Home
This home is located at 9417 Cherry Hills Ln, San Ramon, CA 94583 and is currently estimated at $1,736,824, approximately $851 per square foot. 9417 Cherry Hills Ln is a home located in Contra Costa County with nearby schools including Walt Disney Elementary School, Pine Valley Middle School, and California High School.
Ownership History
Date
Name
Owned For
Owner Type
Purchase Details
Closed on
Sep 28, 2020
Sold by
Costello Rick A and Costello Marianne M
Bought by
Costello Rick A and Costello Marianne M
Current Estimated Value
Home Financials for this Owner
Home Financials are based on the most recent Mortgage that was taken out on this home.
Original Mortgage
$687,000
Outstanding Balance
$617,914
Interest Rate
2.9%
Mortgage Type
New Conventional
Estimated Equity
$1,118,910
Purchase Details
Closed on
Sep 12, 2019
Sold by
Vanderlip Robert J and Yantis Marchele R
Bought by
Vanderlip Robert J and Yantis Marchele R
Purchase Details
Closed on
Jun 24, 1998
Sold by
Richter Janet I and Richter Janet I
Bought by
Vanderlip Robert J and Yantis Marchele R
Home Financials for this Owner
Home Financials are based on the most recent Mortgage that was taken out on this home.
Original Mortgage
$278,000
Interest Rate
7.17%
Mortgage Type
Purchase Money Mortgage
Create a Home Valuation Report for This Property
The Home Valuation Report is an in-depth analysis detailing your home's value as well as a comparison with similar homes in the area
Home Values in the Area
Average Home Value in this Area
Purchase History
| Date | Buyer | Sale Price | Title Company |
|---|---|---|---|
| Costello Rick A | -- | Chicago Title | |
| Vanderlip Robert J | -- | None Available | |
| Vanderlip Robert J | $347,500 | Fidelity National Title Co |
Source: Public Records
Mortgage History
| Date | Status | Borrower | Loan Amount |
|---|---|---|---|
| Open | Costello Rick A | $687,000 | |
| Closed | Vanderlip Robert J | $124,000 | |
| Closed | Vanderlip Robert J | $250,000 | |
| Closed | Vanderlip Robert J | $260,000 | |
| Closed | Vanderlip Robert J | $265,000 | |
| Closed | Vanderlip Robert J | $278,000 |
Source: Public Records
Tax History Compared to Growth
Tax History
| Year | Tax Paid | Tax Assessment Tax Assessment Total Assessment is a certain percentage of the fair market value that is determined by local assessors to be the total taxable value of land and additions on the property. | Land | Improvement |
|---|---|---|---|---|
| 2024 | $6,532 | $543,970 | $226,976 | $316,994 |
| 2023 | $6,532 | $533,305 | $222,526 | $310,779 |
| 2022 | $6,484 | $522,849 | $218,163 | $304,686 |
| 2021 | $6,358 | $512,598 | $213,886 | $298,712 |
| 2019 | $6,220 | $497,396 | $207,543 | $289,853 |
| 2018 | $5,990 | $487,644 | $203,474 | $284,170 |
| 2017 | $5,773 | $478,084 | $199,485 | $278,599 |
| 2016 | $5,696 | $468,711 | $195,574 | $273,137 |
| 2015 | $5,642 | $461,672 | $192,637 | $269,035 |
| 2014 | $5,575 | $452,629 | $188,864 | $263,765 |
Source: Public Records
Map
Nearby Homes
- 9461 Thunderbird Place
- 216 Tangerine Ct
- 169 Pebble Place
- 129 Belle Meade Place
- 101 Neptune Place
- 9014 Craydon Cir
- 520 Columbia Creek Dr
- 9054 Craydon Cir
- 521 Winding Brook Ct
- 663 Greylyn Dr
- 50 Elmwood Dr
- 9085 Alcosta Blvd Unit 324
- 9085 Alcosta Blvd Unit 377
- 825 Spring Brook Dr
- 8610 Beverly Ln
- 3070 Pine Valley Rd
- 7570 Carlow Way
- 183 Madelia Place
- 50 Tom Ct
- 7591 Northland Place