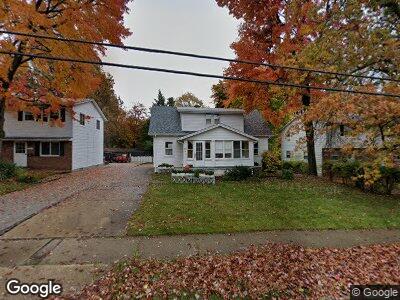
949 Morris Rd Kent, OH 44240
Franklin NeighborhoodEstimated Value: $186,000 - $227,000
4
Beds
2
Baths
1,234
Sq Ft
$167/Sq Ft
Est. Value
About This Home
This home is located at 949 Morris Rd, Kent, OH 44240 and is currently estimated at $206,352, approximately $167 per square foot. 949 Morris Rd is a home located in Portage County with nearby schools including Holden Elementary School, Stanton Middle School, and Theodore Roosevelt High School.
Ownership History
Date
Name
Owned For
Owner Type
Purchase Details
Closed on
Jul 12, 2002
Sold by
Felton Randall C
Bought by
Wanca John C and Pike Sharon E
Current Estimated Value
Home Financials for this Owner
Home Financials are based on the most recent Mortgage that was taken out on this home.
Original Mortgage
$72,000
Interest Rate
6.79%
Purchase Details
Closed on
Apr 5, 1991
Bought by
Felton Randall C
Create a Home Valuation Report for This Property
The Home Valuation Report is an in-depth analysis detailing your home's value as well as a comparison with similar homes in the area
Home Values in the Area
Average Home Value in this Area
Purchase History
| Date | Buyer | Sale Price | Title Company |
|---|---|---|---|
| Wanca John C | $103,000 | Approved Statewide Title Age | |
| Felton Randall C | $60,000 | -- |
Source: Public Records
Mortgage History
| Date | Status | Borrower | Loan Amount |
|---|---|---|---|
| Closed | Wanca John C | $72,000 |
Source: Public Records
Tax History Compared to Growth
Tax History
| Year | Tax Paid | Tax Assessment Tax Assessment Total Assessment is a certain percentage of the fair market value that is determined by local assessors to be the total taxable value of land and additions on the property. | Land | Improvement |
|---|---|---|---|---|
| 2024 | $2,677 | $58,210 | $9,800 | $48,410 |
| 2023 | $2,666 | $46,030 | $10,710 | $35,320 |
| 2022 | $2,542 | $46,030 | $10,710 | $35,320 |
| 2021 | $2,547 | $46,030 | $10,710 | $35,320 |
| 2020 | $2,332 | $37,070 | $10,710 | $26,360 |
| 2019 | $2,314 | $37,070 | $10,710 | $26,360 |
| 2018 | $2,336 | $34,860 | $12,250 | $22,610 |
| 2017 | $2,336 | $34,860 | $12,250 | $22,610 |
| 2016 | $2,330 | $34,860 | $12,250 | $22,610 |
| 2015 | $2,331 | $34,860 | $12,250 | $22,610 |
| 2014 | $2,311 | $33,990 | $12,250 | $21,740 |
| 2013 | $2,294 | $33,990 | $12,250 | $21,740 |
Source: Public Records
Map
Nearby Homes
- 487 Marigold Ln
- 1340 Morris Rd
- 208 E Elm St
- 140 E Oak St
- 138 E School St
- 4363 Ohio 43
- 0 S Water St
- 1619 Chadwick Dr
- 715 Franklin Ave
- 1430 Loop Rd Unit 1430
- 1227 Fairview Dr
- 315 Harris St
- 1737 Holly Dr
- 506 Dansel St
- 5929 Rhodes Rd
- 0 6th Ave
- 6263 5th Ave
- 463 Carthage Ave
- 912 Middlebury Rd
- 409 W Grant St