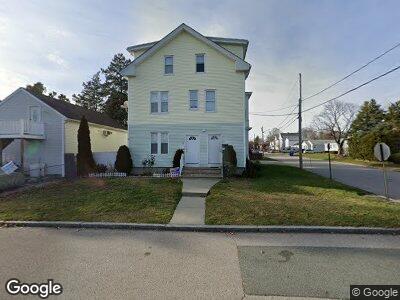
95 N Hull St East Providence, RI 02914
Carpenters Corner NeighborhoodEstimated Value: $541,225 - $747,000
9
Beds
3
Baths
3,203
Sq Ft
$203/Sq Ft
Est. Value
About This Home
This home is located at 95 N Hull St, East Providence, RI 02914 and is currently estimated at $649,806, approximately $202 per square foot. 95 N Hull St is a home located in Providence County with nearby schools including East Providence High School, Ocean State Montessori School, and The Gordon School.
Ownership History
Date
Name
Owned For
Owner Type
Purchase Details
Closed on
Oct 31, 2017
Sold by
Pires Nelson S
Bought by
Pires Nelson S and Pires Christine A
Current Estimated Value
Purchase Details
Closed on
Feb 18, 2005
Sold by
Escobar Antonio and Escobar Maria
Bought by
Pires Nelson
Home Financials for this Owner
Home Financials are based on the most recent Mortgage that was taken out on this home.
Original Mortgage
$315,056
Interest Rate
5.78%
Mortgage Type
Purchase Money Mortgage
Create a Home Valuation Report for This Property
The Home Valuation Report is an in-depth analysis detailing your home's value as well as a comparison with similar homes in the area
Home Values in the Area
Average Home Value in this Area
Purchase History
| Date | Buyer | Sale Price | Title Company |
|---|---|---|---|
| Pires Nelson S | -- | -- | |
| Pires Nelson S | -- | -- | |
| Pires Nelson | $320,000 | -- | |
| Pires Nelson | $320,000 | -- |
Source: Public Records
Mortgage History
| Date | Status | Borrower | Loan Amount |
|---|---|---|---|
| Previous Owner | Pires Nelson | $285,746 | |
| Previous Owner | Pires Nelson | $315,056 |
Source: Public Records
Tax History Compared to Growth
Tax History
| Year | Tax Paid | Tax Assessment Tax Assessment Total Assessment is a certain percentage of the fair market value that is determined by local assessors to be the total taxable value of land and additions on the property. | Land | Improvement |
|---|---|---|---|---|
| 2024 | $6,692 | $436,500 | $73,700 | $362,800 |
| 2023 | $6,443 | $436,500 | $73,700 | $362,800 |
| 2022 | $6,326 | $289,400 | $39,300 | $250,100 |
| 2021 | $6,222 | $289,400 | $39,300 | $250,100 |
| 2020 | $5,959 | $289,400 | $39,300 | $250,100 |
| 2019 | $5,794 | $289,400 | $39,300 | $250,100 |
| 2018 | $4,992 | $218,200 | $41,000 | $177,200 |
| 2017 | $4,881 | $218,200 | $41,000 | $177,200 |
| 2016 | $4,857 | $218,200 | $41,000 | $177,200 |
| 2015 | $5,095 | $222,000 | $33,200 | $188,800 |
| 2014 | $5,095 | $222,000 | $33,200 | $188,800 |
Source: Public Records