
Seller's Agent in 2025
Angeles Curry
Pearson Smith Realty, LLC
(703) 629-8449
1 in this area
41 Total Sales
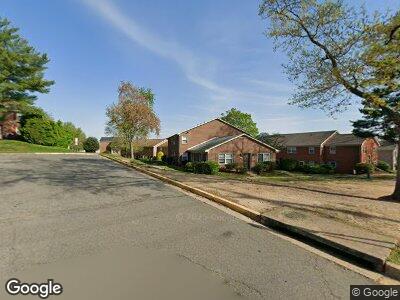
Welcome to this comfortable and spacious end unit two-level townhome. Property offers two-bedrooms, one-bath home and large deck. Upgraded kitchen and bathroom. Spacious floorplan with two generously sized bedrooms and natural light throughout the home. Primary bedroom has a large walk in closet. Newer HVAC system and water heater. This friendly community offers pool, a well-maintained playground and plenty of parking. Conveniently located near shopping, dining, and major commuter routes. Close to I-95 and Fort Belvoir.
| Date | Buyer | Sale Price | Title Company |
|---|---|---|---|
| Lemus Lilian A | $275,000 | Chicago Title |
| Date | Event | Price | Change | Sq Ft Price |
|---|---|---|---|---|
| 03/07/2025 03/07/25 | Rented | $2,100 | 0.0% | -- |
| 03/05/2025 03/05/25 | For Rent | $2,100 | 0.0% | -- |
| 03/05/2025 03/05/25 | Off Market | $2,100 | -- | -- |
| 02/24/2025 02/24/25 | For Rent | $2,100 | 0.0% | -- |
| 02/14/2025 02/14/25 | Sold | $275,000 | 0.0% | $285 / Sq Ft |
| 01/16/2025 01/16/25 | For Sale | $275,000 | 0.0% | $285 / Sq Ft |
| 06/30/2017 06/30/17 | Rented | $1,475 | +1.7% | -- |
| 06/06/2017 06/06/17 | Under Contract | -- | -- | -- |
| 05/31/2017 05/31/17 | For Rent | $1,450 | -- | -- |
| Year | Tax Paid | Tax Assessment Tax Assessment Total Assessment is a certain percentage of the fair market value that is determined by local assessors to be the total taxable value of land and additions on the property. | Land | Improvement |
|---|---|---|---|---|
| 2024 | $2,457 | $212,120 | $42,000 | $170,120 |
| 2023 | $2,258 | $200,110 | $40,000 | $160,110 |
| 2022 | $2,288 | $200,110 | $40,000 | $160,110 |
| 2021 | $2,078 | $177,090 | $35,000 | $142,090 |
| 2020 | $1,776 | $150,080 | $30,000 | $120,080 |
| 2019 | $1,776 | $150,080 | $27,000 | $123,080 |
| 2018 | $1,527 | $132,810 | $27,000 | $105,810 |
| 2017 | $1,182 | $128,940 | $26,000 | $102,940 |
| 2016 | $1,436 | $123,980 | $25,000 | $98,980 |
Seller's Agent in 2025
Angeles Curry
Pearson Smith Realty, LLC
(703) 629-8449
1 in this area
41 Total Sales
Seller's Agent in 2025
Ali Farhadov
Compass
(703) 989-3344
1 in this area
120 Total Sales
Seller Co-Listing Agent in 2025
Katherine Karafotas
Compass
(571) 228-8932
1 in this area
39 Total Sales
Buyer's Agent in 2025
Ivonne Leva
Samson Properties
(703) 375-9454
13 Total Sales