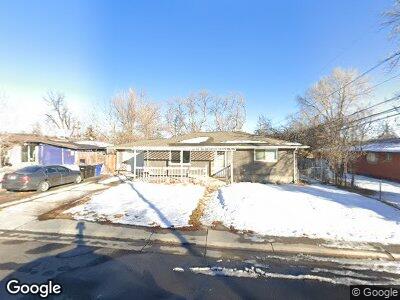
9580 W 53rd Place Arvada, CO 80002
Arvada Plaza Area NeighborhoodEstimated Value: $413,000 - $527,346
3
Beds
2
Baths
1,950
Sq Ft
$241/Sq Ft
Est. Value
About This Home
This home is located at 9580 W 53rd Place, Arvada, CO 80002 and is currently estimated at $469,337, approximately $240 per square foot. 9580 W 53rd Place is a home located in Jefferson County with nearby schools including Arvada K-8, Arvada High School, and Mountain Phoenix Community School.
Ownership History
Date
Name
Owned For
Owner Type
Purchase Details
Closed on
Jun 8, 2011
Sold by
Federal National Mortgage Association
Bought by
Johs Erik M
Current Estimated Value
Home Financials for this Owner
Home Financials are based on the most recent Mortgage that was taken out on this home.
Original Mortgage
$146,652
Interest Rate
4.81%
Mortgage Type
FHA
Purchase Details
Closed on
Apr 12, 2011
Sold by
Ursini John M and Ursini Joanne E
Bought by
Federal National Mortgage Association
Home Financials for this Owner
Home Financials are based on the most recent Mortgage that was taken out on this home.
Original Mortgage
$146,652
Interest Rate
4.81%
Mortgage Type
FHA
Purchase Details
Closed on
Apr 25, 2001
Sold by
Crapsey Keith D Crapsey Susan L
Bought by
Ursini John M and Ursini Joanne E
Home Financials for this Owner
Home Financials are based on the most recent Mortgage that was taken out on this home.
Original Mortgage
$177,413
Interest Rate
6.81%
Create a Home Valuation Report for This Property
The Home Valuation Report is an in-depth analysis detailing your home's value as well as a comparison with similar homes in the area
Home Values in the Area
Average Home Value in this Area
Purchase History
| Date | Buyer | Sale Price | Title Company |
|---|---|---|---|
| Johs Erik M | $124,000 | None Available | |
| Federal National Mortgage Association | -- | None Available | |
| Ursini John M | $182,900 | -- |
Source: Public Records
Mortgage History
| Date | Status | Borrower | Loan Amount |
|---|---|---|---|
| Open | Johs Erik M | $235,000 | |
| Closed | Johs Erik M | $99,000 | |
| Closed | Johs Erik M | $9,900 | |
| Closed | Johs Erik M | $148,500 | |
| Closed | Johs Erik M | $146,652 | |
| Previous Owner | Ursini John M | $50,000 | |
| Previous Owner | Ursini John M | $177,413 | |
| Previous Owner | Crapsey Keith D | $95,000 |
Source: Public Records
Tax History Compared to Growth
Tax History
| Year | Tax Paid | Tax Assessment Tax Assessment Total Assessment is a certain percentage of the fair market value that is determined by local assessors to be the total taxable value of land and additions on the property. | Land | Improvement |
|---|---|---|---|---|
| 2024 | $3,106 | $32,022 | $18,269 | $13,753 |
| 2023 | $3,106 | $32,022 | $18,269 | $13,753 |
| 2022 | $2,705 | $27,625 | $11,060 | $16,565 |
| 2021 | $2,750 | $28,421 | $11,379 | $17,042 |
| 2020 | $2,485 | $25,750 | $9,848 | $15,902 |
| 2019 | $2,451 | $25,750 | $9,848 | $15,902 |
| 2018 | $2,122 | $21,675 | $6,208 | $15,467 |
| 2017 | $1,943 | $21,675 | $6,208 | $15,467 |
| 2016 | $1,694 | $17,598 | $5,539 | $12,059 |
| 2015 | $1,487 | $17,598 | $5,539 | $12,059 |
| 2014 | $1,487 | $14,687 | $4,872 | $9,815 |
Source: Public Records
Map
Nearby Homes
- 9309 Highland Place
- 9380 W 51st Ave
- 5329 Flower Cir
- 5075 Garrison St Unit 3
- 9405 W 54th Place
- 9139 W 50th Ln Unit 204
- 4931 Garrison St Unit 204G
- 9350 Grandview Ave
- 5174 Dudley St
- 5235 Dover St
- 9240 W 49th Ave Unit 317
- 5211 Dover St
- 6730 W 54th Ave
- 5274 Cody St
- 5140 Dover St
- 9320 W 48th Ave
- 9468 W 58th Ave Unit C
- 8408 W 52nd Ave
- 4797 Flower St Unit 4797
- 5743 Field St