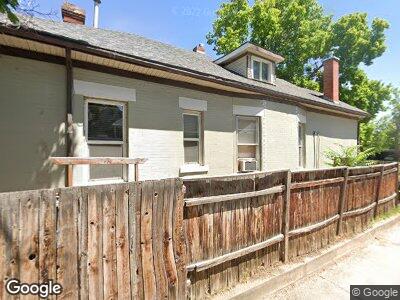
959 E 300 S Salt Lake City, UT 84102
East Central NeighborhoodEstimated Value: $487,000 - $729,000
2
Beds
2
Baths
1,432
Sq Ft
$433/Sq Ft
Est. Value
About This Home
This home is located at 959 E 300 S, Salt Lake City, UT 84102 and is currently estimated at $620,476, approximately $433 per square foot. 959 E 300 S is a home located in Salt Lake County with nearby schools including Bennion Elementary School, Wasatch Elementary School, and East High School.
Ownership History
Date
Name
Owned For
Owner Type
Purchase Details
Closed on
Feb 15, 2017
Sold by
Vanvanallmen Erica Van
Bought by
Vonvonallmen Erica Von and Erica Von Allmen Living Trust
Current Estimated Value
Purchase Details
Closed on
Oct 24, 1997
Sold by
Bithell Paul L
Bought by
Vonallmen Erica and Vonallmen Heidi
Purchase Details
Closed on
Aug 1, 1995
Sold by
Beehive State Employees Credit Union
Bought by
Lindsley Ronald W
Home Financials for this Owner
Home Financials are based on the most recent Mortgage that was taken out on this home.
Original Mortgage
$95,700
Interest Rate
7.62%
Mortgage Type
FHA
Purchase Details
Closed on
Jul 31, 1995
Sold by
Lindsley Ronald W
Bought by
Bithell Paul L
Home Financials for this Owner
Home Financials are based on the most recent Mortgage that was taken out on this home.
Original Mortgage
$95,700
Interest Rate
7.62%
Mortgage Type
FHA
Purchase Details
Closed on
Apr 8, 1994
Sold by
Walther John H
Bought by
Vonallmen Erica and Von Allmen Heidi
Create a Home Valuation Report for This Property
The Home Valuation Report is an in-depth analysis detailing your home's value as well as a comparison with similar homes in the area
Home Values in the Area
Average Home Value in this Area
Purchase History
| Date | Buyer | Sale Price | Title Company |
|---|---|---|---|
| Vonvonallmen Erica Von | -- | None Available | |
| Vonallmen Erica | -- | -- | |
| Lindsley Ronald W | -- | -- | |
| Bithell Paul L | -- | -- | |
| Vonallmen Erica | -- | -- |
Source: Public Records
Mortgage History
| Date | Status | Borrower | Loan Amount |
|---|---|---|---|
| Previous Owner | Bithell Paul L | $95,700 |
Source: Public Records
Tax History Compared to Growth
Tax History
| Year | Tax Paid | Tax Assessment Tax Assessment Total Assessment is a certain percentage of the fair market value that is determined by local assessors to be the total taxable value of land and additions on the property. | Land | Improvement |
|---|---|---|---|---|
| 2023 | $2,680 | $492,900 | $206,800 | $286,100 |
| 2022 | $2,948 | $508,600 | $202,700 | $305,900 |
| 2021 | $2,779 | $434,100 | $156,700 | $277,400 |
| 2020 | $2,637 | $392,200 | $142,800 | $249,400 |
| 2019 | $2,595 | $363,100 | $136,400 | $226,700 |
| 2018 | $2,513 | $342,400 | $136,400 | $206,000 |
| 2017 | $2,673 | $341,200 | $136,400 | $204,800 |
| 2016 | $2,542 | $308,100 | $105,100 | $203,000 |
| 2015 | $2,726 | $313,200 | $108,400 | $204,800 |
| 2014 | $2,637 | $300,500 | $106,200 | $194,300 |
Source: Public Records
Map
Nearby Homes
- 962 E 300 S
- 369 S 1000 E
- 332 S 1100 E
- 1032 E 400 S Unit 402B
- 151 Windsor St
- 960 E 100 S Unit D7
- 426 S 1000 E Unit 600
- 425 S 1000 E Unit 203C
- 128 S Windsor St
- 128 S Dooley Ct
- 366 S Elizabeth St
- 1116 E 400 S
- 828 E 100 S
- 115 S 1100 E Unit 614
- 115 S 1100 E Unit 506
- 249 S 700 E Unit 58
- 130 S 800 E
- 110 S 800 E Unit 304
- 1161 E Bueno Ave
- 148 S 1200 E