966 Tradewind St New Bedford, MA 02740
Rockdale NeighborhoodEstimated Value: $417,000 - $464,000
4
Beds
2
Baths
1,260
Sq Ft
$345/Sq Ft
Est. Value
About This Home
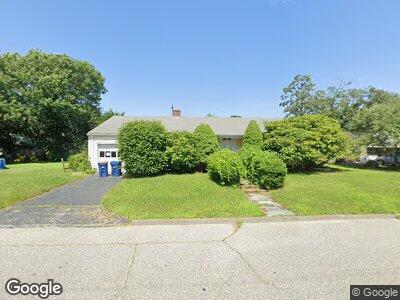
This home is located at 966 Tradewind St, New Bedford, MA 02740 and is currently estimated at $434,883, approximately $345 per square foot. 966 Tradewind St is a home located in Bristol County with nearby schools including Elizabeth Carter Brooks Elementary School, Keith Middle School, and New Bedford High School.
Ownership History
Date
Name
Owned For
Owner Type
Purchase Details
Closed on
Jul 16, 2024
Sold by
Kenyon Anthony P
Bought by
Kent Group Rt and Kenyon
Current Estimated Value
Purchase Details
Closed on
Sep 24, 2001
Sold by
Kenyon Louis A
Bought by
Kenyon Anthony P
Purchase Details
Closed on
--
Sold by
Kenyon Louis A
Bought by
Kenyon Anthony P
Create a Home Valuation Report for This Property
The Home Valuation Report is an in-depth analysis detailing your home's value as well as a comparison with similar homes in the area
Home Values in the Area
Average Home Value in this Area
Purchase History
| Date | Buyer | Sale Price | Title Company |
|---|---|---|---|
| Kent Group Rt | -- | None Available | |
| Kent Group Rt | -- | None Available | |
| Kenyon Anthony P | $60,867 | -- | |
| Kenyon Anthony P | $60,867 | -- |
Source: Public Records
Tax History Compared to Growth
Tax History
| Year | Tax Paid | Tax Assessment Tax Assessment Total Assessment is a certain percentage of the fair market value that is determined by local assessors to be the total taxable value of land and additions on the property. | Land | Improvement |
|---|---|---|---|---|
| 2024 | $4,297 | $358,100 | $124,100 | $234,000 |
| 2023 | $4,278 | $299,400 | $107,000 | $192,400 |
| 2022 | $3,947 | $254,000 | $101,700 | $152,300 |
| 2021 | $3,877 | $248,700 | $101,700 | $147,000 |
| 2020 | $3,912 | $242,100 | $101,700 | $140,400 |
| 2019 | $3,793 | $230,300 | $101,700 | $128,600 |
| 2018 | $3,705 | $222,800 | $109,900 | $112,900 |
| 2017 | $3,543 | $212,300 | $107,800 | $104,500 |
| 2016 | $3,283 | $199,100 | $105,800 | $93,300 |
| 2015 | $3,100 | $197,100 | $105,800 | $91,300 |
| 2014 | $3,141 | $207,200 | $105,800 | $101,400 |
Source: Public Records
Map
Nearby Homes
- 809 Hathaway Rd
- 915 Hathaway Rd Unit 203
- 805 Hathaway Rd Unit 809
- 59 Wilbur Ave
- 99 Bryant St
- 53 Pineridge St
- 17 Eisenhower St
- 1328 Rockdale Ave
- 49 Templeton St
- 0 Hathaway Rd
- 0 Middlesex St
- 0 Norfolk Ave Unit 72900174
- 19 Kingston St
- 24-26 Robert St
- 160 Hapwell St
- 153 Macomber St
- 342 Hathaway Blvd Unit 18
- 20 Champion Terrace
- 10 Champion Terrace
- ) Hapwell & Summit St