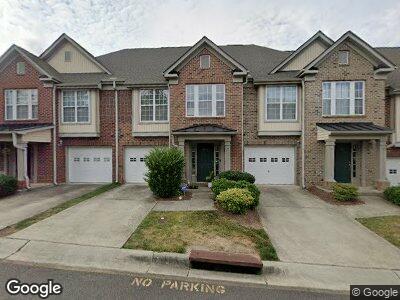
9705 Blackwell Dr Raleigh, NC 27617
Brier Creek NeighborhoodEstimated Value: $317,000 - $408,000
2
Beds
3
Baths
1,409
Sq Ft
$249/Sq Ft
Est. Value
About This Home
This home is located at 9705 Blackwell Dr, Raleigh, NC 27617 and is currently estimated at $350,408, approximately $248 per square foot. 9705 Blackwell Dr is a home located in Wake County with nearby schools including Brier Creek Elementary School, Pine Hollow Middle School, and Leesville Road High School.
Ownership History
Date
Name
Owned For
Owner Type
Purchase Details
Closed on
Nov 2, 2016
Sold by
Burke Cedric and Thompson Jennifer
Bought by
Zhang Tian Wu and Lin Ying
Current Estimated Value
Purchase Details
Closed on
Jun 28, 2007
Sold by
Defalco Amy and Defalco Jeremy
Bought by
Burke Cedric
Home Financials for this Owner
Home Financials are based on the most recent Mortgage that was taken out on this home.
Original Mortgage
$168,000
Interest Rate
6.16%
Mortgage Type
New Conventional
Purchase Details
Closed on
Apr 8, 2005
Sold by
Gateway Homes Llc
Bought by
Hairfield Amy L
Home Financials for this Owner
Home Financials are based on the most recent Mortgage that was taken out on this home.
Original Mortgage
$82,000
Interest Rate
5.5%
Mortgage Type
Fannie Mae Freddie Mac
Create a Home Valuation Report for This Property
The Home Valuation Report is an in-depth analysis detailing your home's value as well as a comparison with similar homes in the area
Home Values in the Area
Average Home Value in this Area
Purchase History
| Date | Buyer | Sale Price | Title Company |
|---|---|---|---|
| Zhang Tian Wu | $180,000 | None Available | |
| Burke Cedric | $168,000 | None Available | |
| Hairfield Amy L | $109,500 | -- |
Source: Public Records
Mortgage History
| Date | Status | Borrower | Loan Amount |
|---|---|---|---|
| Open | Zhang Tian Wu | $131,073 | |
| Closed | Zhang Tian Wu | $142,500 | |
| Previous Owner | Burke Cedric | $162,700 | |
| Previous Owner | Burke Cedric | $168,000 | |
| Previous Owner | Hairfield Amy L | $82,000 |
Source: Public Records
Tax History Compared to Growth
Tax History
| Year | Tax Paid | Tax Assessment Tax Assessment Total Assessment is a certain percentage of the fair market value that is determined by local assessors to be the total taxable value of land and additions on the property. | Land | Improvement |
|---|---|---|---|---|
| 2024 | $3,027 | $346,270 | $85,000 | $261,270 |
| 2023 | $2,156 | $195,934 | $55,000 | $140,934 |
| 2022 | $2,004 | $195,934 | $55,000 | $140,934 |
| 2021 | $1,926 | $195,934 | $55,000 | $140,934 |
| 2020 | $1,892 | $195,934 | $55,000 | $140,934 |
| 2019 | $1,918 | $163,815 | $46,000 | $117,815 |
| 2018 | $1,810 | $163,815 | $46,000 | $117,815 |
| 2017 | $1,724 | $163,815 | $46,000 | $117,815 |
| 2016 | $1,689 | $163,815 | $46,000 | $117,815 |
| 2015 | $1,569 | $149,633 | $31,000 | $118,633 |
| 2014 | $1,489 | $149,633 | $31,000 | $118,633 |
Source: Public Records
Map
Nearby Homes
- 9911 Grettle Ct
- 9910 Clyborn Ct
- 2118 Kedvale Ave
- 9308 Wooden Rd
- 9240 Wooden Rd
- 10119 Glen Autumn Rd
- 9206 Wooden Rd
- 9207 Wooden Rd
- 10110 Lynnberry Place
- 10105 Raven Tree Dr
- 9345 Falkwood Rd
- 11548 Helmond Way Unit 103
- 11548 Helmond Way Unit 118
- 11548 Helmond Way Unit 120
- 9103 Maria Luisa Place
- 10009 Lynnberry Place
- 9203 Semana Walk
- 9200 Torre Del Oro Place
- 11549 Helmond Way Unit 103
- 11549 Helmond Way Unit 116