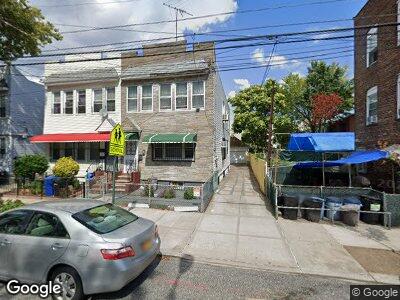
9745 83rd St Ozone Park, NY 11416
Ozone Park NeighborhoodEstimated Value: $759,112 - $965,000
--
Bed
--
Bath
1,680
Sq Ft
$516/Sq Ft
Est. Value
About This Home
This home is located at 9745 83rd St, Ozone Park, NY 11416 and is currently estimated at $866,528, approximately $515 per square foot. 9745 83rd St is a home located in Queens County with nearby schools including P.S. 64 - Joseph P. Addabbo, Jhs 210 Elizabeth Blackwell, and Cypress Hills Ascend Charter Lower School.
Ownership History
Date
Name
Owned For
Owner Type
Purchase Details
Closed on
Jul 16, 2018
Sold by
Sewnaraine Ishwardeen
Bought by
Liu Nan and Shen Suxian
Current Estimated Value
Home Financials for this Owner
Home Financials are based on the most recent Mortgage that was taken out on this home.
Original Mortgage
$511,000
Outstanding Balance
$451,954
Interest Rate
4.5%
Mortgage Type
Purchase Money Mortgage
Estimated Equity
$378,583
Purchase Details
Closed on
Mar 22, 2012
Sold by
Seenarine Yasodra and Sewnaraine Ishwardeen
Bought by
Sewnaraine Ishwardeen
Purchase Details
Closed on
Feb 26, 2008
Sold by
Seenarine Narandra and Seenarine Yasodra
Bought by
Seenarine Yasodra and Sewnaraine Ishwardeen
Purchase Details
Closed on
Jun 9, 2007
Sold by
Sewnaraine Ishwardeen
Bought by
Seenarine Narendra and Seenarine Yasodra V
Purchase Details
Closed on
Oct 18, 2004
Sold by
Conza Diana and Conza Peter J
Bought by
Sewnaraine Ishwardeen
Create a Home Valuation Report for This Property
The Home Valuation Report is an in-depth analysis detailing your home's value as well as a comparison with similar homes in the area
Home Values in the Area
Average Home Value in this Area
Purchase History
| Date | Buyer | Sale Price | Title Company |
|---|---|---|---|
| Liu Nan | $730,000 | -- | |
| Liu Nan | $730,000 | -- | |
| Sewnaraine Ishwardeen | -- | -- | |
| Sewnaraine Ishwardeen | -- | -- | |
| Seenarine Yasodra | -- | -- | |
| Seenarine Yasodra | -- | -- | |
| Seenarine Narendra | -- | -- | |
| Seenarine Narendra | -- | -- | |
| Sewnaraine Ishwardeen | -- | -- | |
| Sewnaraine Ishwardeen | -- | -- |
Source: Public Records
Mortgage History
| Date | Status | Borrower | Loan Amount |
|---|---|---|---|
| Open | Liu Nan | $511,000 | |
| Closed | Liu Nan | $511,000 |
Source: Public Records
Tax History Compared to Growth
Tax History
| Year | Tax Paid | Tax Assessment Tax Assessment Total Assessment is a certain percentage of the fair market value that is determined by local assessors to be the total taxable value of land and additions on the property. | Land | Improvement |
|---|---|---|---|---|
| 2024 | $6,898 | $35,686 | $12,675 | $23,011 |
| 2023 | $6,541 | $33,966 | $12,644 | $21,322 |
| 2022 | $6,150 | $43,620 | $16,260 | $27,360 |
| 2021 | $6,490 | $46,680 | $16,260 | $30,420 |
| 2020 | $6,365 | $45,660 | $16,260 | $29,400 |
| 2019 | $5,928 | $40,680 | $16,260 | $24,420 |
| 2018 | $5,770 | $28,305 | $13,771 | $14,534 |
| 2017 | $5,478 | $26,872 | $13,098 | $13,774 |
| 2016 | $5,372 | $26,872 | $13,098 | $13,774 |
| 2015 | $3,058 | $26,224 | $16,830 | $9,394 |
| 2014 | $3,058 | $24,782 | $16,358 | $8,424 |
Source: Public Records
Map
Nearby Homes