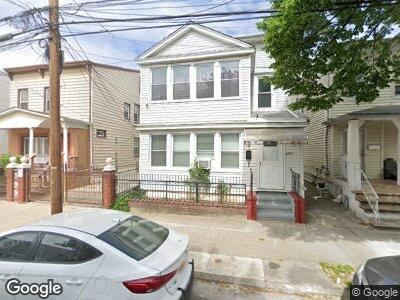
9745 89th St Ozone Park, NY 11416
Ozone Park NeighborhoodEstimated Value: $746,546 - $952,000
--
Bed
--
Bath
1,760
Sq Ft
$467/Sq Ft
Est. Value
About This Home
This home is located at 9745 89th St, Ozone Park, NY 11416 and is currently estimated at $821,637, approximately $466 per square foot. 9745 89th St is a home located in Queens County with nearby schools including New York City Academy For Discovery, Jhs 210 Elizabeth Blackwell, and Divine Mercy Catholic Academy.
Ownership History
Date
Name
Owned For
Owner Type
Purchase Details
Closed on
Nov 1, 2012
Sold by
Ramsumer Michael and Ramsumer Pattraychan
Bought by
Ramsumer Joshua and Ramsumer Michael
Current Estimated Value
Purchase Details
Closed on
Jun 16, 2011
Sold by
Basdeo Drupatie and Mohan Drupatie
Bought by
Ramsumer Michael and Ramsumer Pattraychan
Home Financials for this Owner
Home Financials are based on the most recent Mortgage that was taken out on this home.
Original Mortgage
$361,595
Interest Rate
4.58%
Mortgage Type
Purchase Money Mortgage
Purchase Details
Closed on
Jun 12, 2001
Sold by
Basdeo Drupatie and Mohan Drupatie
Bought by
Mohan Drupatie and Basdeo Drupatie
Purchase Details
Closed on
Aug 31, 1999
Sold by
Piskorowski Jean
Bought by
Basdeo Teelochan and Basdeo Drupatie
Home Financials for this Owner
Home Financials are based on the most recent Mortgage that was taken out on this home.
Original Mortgage
$185,250
Interest Rate
7.8%
Mortgage Type
Unknown
Create a Home Valuation Report for This Property
The Home Valuation Report is an in-depth analysis detailing your home's value as well as a comparison with similar homes in the area
Home Values in the Area
Average Home Value in this Area
Purchase History
| Date | Buyer | Sale Price | Title Company |
|---|---|---|---|
| Ramsumer Joshua | $355,000 | -- | |
| Ramsumer Michael | $371,000 | -- | |
| Mohan Drupatie | -- | -- | |
| Basdeo Teelochan | $195,000 | Commonwealth Land Title Ins |
Source: Public Records
Mortgage History
| Date | Status | Borrower | Loan Amount |
|---|---|---|---|
| Open | Ramsumer Joshua | $364,000 | |
| Previous Owner | Ramsumer Michael | $361,595 | |
| Previous Owner | Basdeo Teelochan | $185,250 |
Source: Public Records
Tax History Compared to Growth
Tax History
| Year | Tax Paid | Tax Assessment Tax Assessment Total Assessment is a certain percentage of the fair market value that is determined by local assessors to be the total taxable value of land and additions on the property. | Land | Improvement |
|---|---|---|---|---|
| 2024 | $6,217 | $30,954 | $10,173 | $20,781 |
| 2023 | $5,872 | $29,237 | $9,322 | $19,915 |
| 2022 | $5,579 | $44,040 | $15,420 | $28,620 |
| 2021 | $5,585 | $43,860 | $15,420 | $28,440 |
| 2020 | $5,487 | $46,380 | $15,420 | $30,960 |
| 2019 | $5,103 | $46,500 | $15,420 | $31,080 |
| 2018 | $4,669 | $24,364 | $10,401 | $13,963 |
| 2017 | $4,448 | $23,288 | $10,093 | $13,195 |
| 2016 | $4,346 | $23,288 | $10,093 | $13,195 |
| 2015 | $2,430 | $22,767 | $13,378 | $9,389 |
| 2014 | $2,430 | $21,496 | $13,318 | $8,178 |
Source: Public Records
Map
Nearby Homes
- 97-19 89th St
- 90-10 101st Ave
- 101-09 90th St
- 88-16 97th Ave
- 9712 91st St
- 97-14 88th St
- 8910 Rockaway Blvd
- 89-10 Rockaway Blvd
- 88-17 97th Ave
- 87-18 97th Ave
- 88-05 97th Ave
- 9005 Rockaway Blvd
- 97-34 92nd St
- 9521 89th St
- 97-14 92nd St
- 9520 89th St
- 9512 89th St
- 86-05 102nd Ave
- 92-08 95th Ave
- 9427 87th St