99 Parkview Dr Eldridge, IA 52748
Estimated Value: $436,000 - $480,000
4
Beds
3
Baths
1,905
Sq Ft
$237/Sq Ft
Est. Value
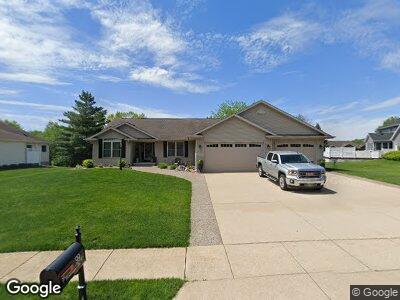
About This Home
This home is located at 99 Parkview Dr, Eldridge, IA 52748 and is currently estimated at $450,905, approximately $236 per square foot. 99 Parkview Dr is a home located in Scott County with nearby schools including Neil Armstrong Elementary School, North Scott Junior High School, and North Scott Senior High School.
Ownership History
Date
Name
Owned For
Owner Type
Purchase Details
Closed on
Feb 17, 2021
Sold by
Campbell Lisa A
Bought by
Campbell Lisa A and Lisa A Campell Revocable Trust
Current Estimated Value
Purchase Details
Closed on
Jan 20, 2021
Sold by
Campbell Lisa A and Campbell Shane W
Bought by
Campbell Lisa A
Purchase Details
Closed on
Nov 18, 2011
Sold by
Wahl James R and Wahl Melinda K
Bought by
Campbell Lisa A and Campbell Shane W
Home Financials for this Owner
Home Financials are based on the most recent Mortgage that was taken out on this home.
Original Mortgage
$152,500
Outstanding Balance
$23,848
Interest Rate
3.97%
Mortgage Type
New Conventional
Estimated Equity
$428,755
Purchase Details
Closed on
Apr 15, 2005
Sold by
Wahl James R and Wahl Melinda K
Bought by
Wahl James R and Wahl Melinda K
Home Financials for this Owner
Home Financials are based on the most recent Mortgage that was taken out on this home.
Original Mortgage
$205,000
Interest Rate
6.06%
Mortgage Type
New Conventional
Create a Home Valuation Report for This Property
The Home Valuation Report is an in-depth analysis detailing your home's value as well as a comparison with similar homes in the area
Home Values in the Area
Average Home Value in this Area
Purchase History
| Date | Buyer | Sale Price | Title Company |
|---|---|---|---|
| Campbell Lisa A | -- | None Available | |
| Campbell Lisa A | $277,500 | None Available | |
| Wahl James R | -- | None Available |
Source: Public Records
Mortgage History
| Date | Status | Borrower | Loan Amount |
|---|---|---|---|
| Open | Campbell Lisa A | $152,500 | |
| Previous Owner | Wahl James R | $205,000 |
Source: Public Records
Tax History Compared to Growth
Tax History
| Year | Tax Paid | Tax Assessment Tax Assessment Total Assessment is a certain percentage of the fair market value that is determined by local assessors to be the total taxable value of land and additions on the property. | Land | Improvement |
|---|---|---|---|---|
| 2024 | $4,222 | $403,700 | $73,000 | $330,700 |
| 2023 | $4,106 | $403,700 | $73,000 | $330,700 |
| 2022 | $4,106 | $337,630 | $46,200 | $291,430 |
| 2021 | $4,058 | $337,630 | $46,200 | $291,430 |
| 2020 | $4,084 | $313,850 | $46,200 | $267,650 |
| 2019 | $4,086 | $300,630 | $46,200 | $254,430 |
| 2018 | $4,192 | $300,630 | $46,200 | $254,430 |
| 2017 | $1,672 | $300,630 | $46,200 | $254,430 |
| 2016 | $4,124 | $293,800 | $0 | $0 |
| 2015 | $4,124 | $0 | $0 | $0 |
| 2014 | $3,844 | $269,230 | $0 | $0 |
| 2013 | $3,798 | $0 | $0 | $0 |
| 2012 | -- | $296,300 | $46,200 | $250,100 |
Source: Public Records
Map
Nearby Homes
- 14 Park Avenue Ct
- 4 Sioux Ct
- 301 S Park View Dr
- 6 Hillcrest Ct
- 8 Hillcrest Ct
- 27087 181st Ave
- 27103 181st Ave
- 27111 181st Ave
- 27007 182nd Avenue Ct
- 4 Manor Dr Unit A-4
- 4 Manor Dr Unit B4
- 4 Manor Dr Unit C-1
- 4 Manor Dr Unit C-6
- 4 Manor Dr Unit B-2
- 21 Manor Dr
- 18101 271st St
- 20874 270th St
- 412 S Diamond Dr
- 414 S Diamond Dr
- 319 N 1st St