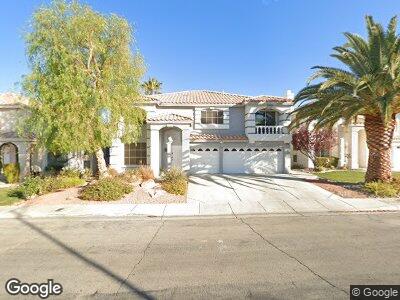
9966 Hawk Feather St Las Vegas, NV 89183
Silverado Ranch NeighborhoodEstimated Value: $572,000 - $620,000
4
Beds
3
Baths
2,929
Sq Ft
$203/Sq Ft
Est. Value
About This Home
This home is located at 9966 Hawk Feather St, Las Vegas, NV 89183 and is currently estimated at $593,765, approximately $202 per square foot. 9966 Hawk Feather St is a home located in Clark County with nearby schools including Shirley A Barber Elementary, Charles Silvestri Junior High School, and Liberty High School.
Ownership History
Date
Name
Owned For
Owner Type
Purchase Details
Closed on
Nov 2, 2004
Sold by
Mobley Sharen Black
Bought by
Mobley Sharen Black
Current Estimated Value
Home Financials for this Owner
Home Financials are based on the most recent Mortgage that was taken out on this home.
Original Mortgage
$285,000
Outstanding Balance
$139,241
Interest Rate
4.87%
Mortgage Type
Unknown
Estimated Equity
$450,193
Purchase Details
Closed on
Mar 7, 2000
Sold by
American West Homes Inc
Bought by
Mobley Robert L and Mobley Sharen Black
Home Financials for this Owner
Home Financials are based on the most recent Mortgage that was taken out on this home.
Original Mortgage
$218,550
Interest Rate
8.26%
Create a Home Valuation Report for This Property
The Home Valuation Report is an in-depth analysis detailing your home's value as well as a comparison with similar homes in the area
Home Values in the Area
Average Home Value in this Area
Purchase History
| Date | Buyer | Sale Price | Title Company |
|---|---|---|---|
| Mobley Sharen Black | -- | North American Title Co | |
| Mobley Robert L | $197,600 | First American Title Co |
Source: Public Records
Mortgage History
| Date | Status | Borrower | Loan Amount |
|---|---|---|---|
| Open | Mobley Sharen Black | $45,000 | |
| Open | Mobley Sharen Black | $285,000 | |
| Closed | Mobley Sharen Black | $48,000 | |
| Previous Owner | Mobley Robert L | $218,550 | |
| Closed | Mobley Sharen Black | $10,000 |
Source: Public Records
Tax History Compared to Growth
Tax History
| Year | Tax Paid | Tax Assessment Tax Assessment Total Assessment is a certain percentage of the fair market value that is determined by local assessors to be the total taxable value of land and additions on the property. | Land | Improvement |
|---|---|---|---|---|
| 2025 | $3,030 | $159,249 | $44,100 | $115,149 |
| 2024 | $2,943 | $159,249 | $44,100 | $115,149 |
| 2023 | $2,943 | $145,342 | $36,750 | $108,592 |
| 2022 | $2,374 | $132,434 | $32,900 | $99,534 |
| 2021 | $2,923 | $125,298 | $30,800 | $94,498 |
| 2020 | $2,690 | $124,615 | $30,800 | $93,815 |
| 2019 | $2,657 | $117,725 | $25,200 | $92,525 |
| 2018 | $2,536 | $111,370 | $22,750 | $88,620 |
| 2017 | $3,182 | $108,508 | $18,550 | $89,958 |
| 2016 | $2,374 | $103,842 | $16,450 | $87,392 |
| 2015 | $2,369 | $88,366 | $12,600 | $75,766 |
| 2014 | $2,300 | $77,924 | $8,750 | $69,174 |
Source: Public Records
Map
Nearby Homes
- 1751 Juniper Twig Ave
- 1677 Balsam Mist Ave
- 9843 Frosty Canyon Ct
- 9852 Snowy Canyon Ct
- 9776 Whitewater Canyon Ct
- 1922 E Pyle Ave
- 1675 Silver Rain Ave
- 1819 Wild Indigo Ct
- 9926 Swimming Hole St
- 10230 Viterbo St
- 9935 Swimming Hole St Unit 1
- 1903 Wild Indigo Ct
- 10282 Keystone Pastures St
- 9920 Keephills St
- 10245 Missouri Meadows St
- 9958 Fragile Fields St
- 10313 Adams Chase St
- 9636 Salford Isle St
- 10342 Cherry Brook St
- 10337 Adams Chase St Unit 1