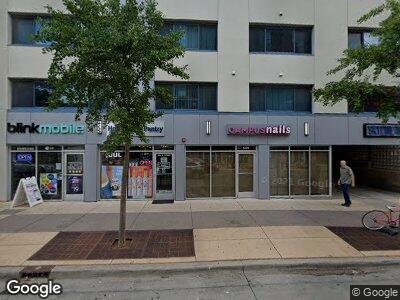
509 E Green St Champaign, IL 61820
Campustown NeighborhoodEstimated Value: $3,796,461
2
Beds
--
Bath
700
Sq Ft
$5,424/Sq Ft
Est. Value
About This Home
Look no further! 509 E. Green is located right next to its sister building, 519 E. Green (The Alma Mater Mural Building), on the corner of Sixth and Green. The Main Quad is just 1 block away, so your morning commute is nearly non-existent. You’ll also love the urban lifestyle with over 50 shops and restaurants nearby. Residents receive access to the newly renovated, beautiful fitness center and lounge next door.
Ownership History
Date
Name
Owned For
Owner Type
Purchase Details
Closed on
Dec 17, 2021
Sold by
Leon Bankier Family Limited Partnership
Bought by
Gsc 509 E Green Llc
Current Estimated Value
Purchase Details
Closed on
Sep 13, 2004
Sold by
Lasalle Bank Na
Bought by
Campus Investors Llc
Create a Home Valuation Report for This Property
The Home Valuation Report is an in-depth analysis detailing your home's value as well as a comparison with similar homes in the area
Home Values in the Area
Average Home Value in this Area
Purchase History
| Date | Buyer | Sale Price | Title Company |
|---|---|---|---|
| Gsc 509 E Green Llc | $3,100,000 | Attorney | |
| Campus Investors Llc | $26,020,500 | -- |
Source: Public Records
Mortgage History
| Date | Status | Borrower | Loan Amount |
|---|---|---|---|
| Open | Gsc 509 E Green Llc | $65,000,000 | |
| Previous Owner | Leon Bankier Family Limited Partnership | $1,000,000 |
Source: Public Records
Property History
| Date | Event | Price | Change | Sq Ft Price |
|---|---|---|---|---|
| 02/04/2025 02/04/25 | Off Market | $1,200 | -- | -- |
| 09/03/2024 09/03/24 | Price Changed | $1,200 | +9.1% | $2 / Sq Ft |
| 04/13/2024 04/13/24 | Price Changed | $1,100 | -18.5% | $2 / Sq Ft |
| 04/09/2024 04/09/24 | Price Changed | $1,350 | +12.5% | $2 / Sq Ft |
| 03/31/2024 03/31/24 | For Rent | $1,200 | -- | -- |
Tax History Compared to Growth
Tax History
| Year | Tax Paid | Tax Assessment Tax Assessment Total Assessment is a certain percentage of the fair market value that is determined by local assessors to be the total taxable value of land and additions on the property. | Land | Improvement |
|---|---|---|---|---|
| 2023 | $45,696 | $506,730 | $192,630 | $314,100 |
| 2022 | $42,987 | $467,460 | $177,700 | $289,760 |
| 2021 | $39,580 | $432,360 | $164,360 | $268,000 |
| 2020 | $37,753 | $411,770 | $156,530 | $255,240 |
| 2019 | $36,540 | $403,300 | $153,310 | $249,990 |
| 2018 | $35,720 | $396,950 | $150,900 | $246,050 |
| 2017 | $35,868 | $396,950 | $150,900 | $246,050 |
| 2016 | $32,159 | $388,790 | $147,800 | $240,990 |
| 2015 | $25,059 | $381,920 | $145,190 | $236,730 |
| 2014 | $24,845 | $295,340 | $58,610 | $236,730 |
| 2013 | $24,622 | $295,340 | $58,610 | $236,730 |
Source: Public Records
Map
Nearby Homes
- 503 E Park St
- 508 E Church St
- 506 E Church St
- 901 W Main St
- 804 W Oregon St
- 507 E Washington St
- 803 W Nevada St
- 1115 W Hill St
- 708 S Busey Ave
- 905 S Busey Ave
- 1008 S Lincoln Ave
- 703 W Oregon St
- 806 W Ohio St
- 609 W California Ave
- 1008 S Busey Ave
- 1105 S Busey Ave
- 212 W John St
- 604 W Main St
- 508 W Elm St
- 611 W Iowa St