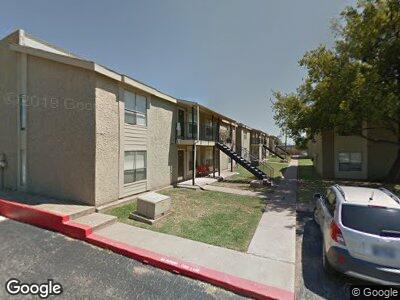
1000 S Clack St Abilene, TX 79605
Dyess Air Force Base Neighborhood
--
Bed
--
Bath
50,330
Sq Ft
5
Acres
About This Home
This home is located at 1000 S Clack St, Abilene, TX 79605. 1000 S Clack St is a home located in Taylor County with nearby schools including Clack Middle School, Cooper High School, and Cornerstone Christian School.
Ownership History
Date
Name
Owned For
Owner Type
Purchase Details
Closed on
Oct 26, 2022
Sold by
Abilene-Clack Street Apartments Llc
Bought by
Bel Air Springs Llc
Home Financials for this Owner
Home Financials are based on the most recent Mortgage that was taken out on this home.
Original Mortgage
$7,428,000
Outstanding Balance
$6,122,364
Interest Rate
6.02%
Mortgage Type
New Conventional
Purchase Details
Closed on
Jun 13, 2013
Sold by
Tilden Quail Run Llc
Bought by
Abilene Clack Street Apartments Llc
Purchase Details
Closed on
Jul 2, 2008
Sold by
Quail Run Apartments Limited Partnership
Bought by
Tilden Quail Run Llc
Home Financials for this Owner
Home Financials are based on the most recent Mortgage that was taken out on this home.
Original Mortgage
$6,291,000
Interest Rate
5.99%
Mortgage Type
Commercial
Create a Home Valuation Report for This Property
The Home Valuation Report is an in-depth analysis detailing your home's value as well as a comparison with similar homes in the area
Home Values in the Area
Average Home Value in this Area
Purchase History
| Date | Buyer | Sale Price | Title Company |
|---|---|---|---|
| Bel Air Springs Llc | -- | First American Title (Fat / Fa | |
| Abilene Clack Street Apartments Llc | -- | Fidelity National Title | |
| Tilden Quail Run Llc | -- | Chicago Title Insurance Co |
Source: Public Records
Mortgage History
| Date | Status | Borrower | Loan Amount |
|---|---|---|---|
| Open | Bel Air Springs Llc | $7,428,000 | |
| Previous Owner | Tilden Quail Run Llc | $3,225,000 | |
| Previous Owner | Tilden Quail Run Llc | $6,291,000 |
Source: Public Records
Tax History Compared to Growth
Tax History
| Year | Tax Paid | Tax Assessment Tax Assessment Total Assessment is a certain percentage of the fair market value that is determined by local assessors to be the total taxable value of land and additions on the property. | Land | Improvement |
|---|---|---|---|---|
| 2023 | $121,622 | $7,522,000 | $236,800 | $7,285,200 |
| 2022 | $149,617 | $5,893,000 | $236,800 | $5,656,200 |
| 2021 | $136,920 | $5,076,000 | $236,800 | $4,839,200 |
| 2020 | $126,814 | $4,623,000 | $236,800 | $4,386,200 |
| 2019 | $98,852 | $3,826,000 | $236,800 | $3,589,200 |
| 2018 | $96,387 | $3,741,000 | $236,800 | $3,504,200 |
| 2017 | $90,799 | $3,653,000 | $236,800 | $3,416,200 |
| 2016 | $84,660 | $3,406,000 | $236,800 | $3,169,200 |
| 2015 | $94,153 | $3,885,000 | $236,800 | $3,648,200 |
| 2014 | $94,153 | $3,885,000 | $0 | $0 |
Source: Public Records
Map
Nearby Homes
- 5258 Fairmont St
- 1302 S Crockett Dr
- 1250 S Bowie Dr
- 1126 S Bowie Dr
- 1026 S Bowie Dr
- 5233 Hartford St
- 1225 S San Jose Dr
- 14 Reagan Cir
- 5201 Pueblo Dr
- 826 S La Salle Dr
- 942 S Jefferson Dr
- 1298 S Pioneer Dr
- 826 S Jefferson Dr
- 706 S San Jose Dr
- 1002 S Pioneer Dr
- 1305 S Pioneer Dr
- 733 S La Salle Dr
- 5457 S 7th St
- 818 S Pioneer Dr
- 610 S San Jose Dr