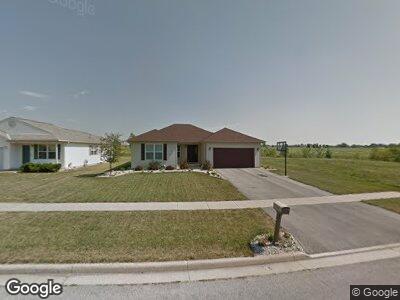
1795 Bishop Ln Findlay, OH 45840
Estimated Value: $211,000 - $244,000
About This Home
We welcome the opportunity to present Blanchard Station Apartments and look forward to sharing our vision with you. Based on our experience building more than sixty communities throughout Ohio, we know that Blanchard Station Apartments will provide an accessible and enhanced community that continually enriches the lives of local families. Design and amenities offer all of the comforts and safety of home. Families will enjoy and take pride in living in a warm and friendly neighborhood that embraces the values and vibrancy of Findlay and Hancock County. The development is expected to serve moderate income families with affordable rents. It will offer up to 50 residential units that feature open floor plans to maximize the amount of livable space, providing comfortable living accommodations for families.
Ownership History
Purchase Details
Home Financials for this Owner
Home Financials are based on the most recent Mortgage that was taken out on this home.Home Values in the Area
Average Home Value in this Area
Purchase History
| Date | Buyer | Sale Price | Title Company |
|---|---|---|---|
| Johnson Pamela L | $136,000 | Assured Title Agency |
Mortgage History
| Date | Status | Borrower | Loan Amount |
|---|---|---|---|
| Open | Johnson Pamela L | $80,000 | |
| Closed | Johnson Pamela L | $90,000 | |
| Closed | Johnson Pamela L | $52,612 | |
| Closed | Johnson Pamela L | $67,682 |
Property History
| Date | Event | Price | Change | Sq Ft Price |
|---|---|---|---|---|
| 12/04/2024 12/04/24 | Off Market | $517 | -- | -- |
| 09/29/2024 09/29/24 | For Rent | $517 | 0.0% | -- |
| 02/23/2024 02/23/24 | Price Changed | $517 | +17.0% | $1 / Sq Ft |
| 02/01/2024 02/01/24 | For Rent | $442 | -- | -- |
Tax History Compared to Growth
Tax History
| Year | Tax Paid | Tax Assessment Tax Assessment Total Assessment is a certain percentage of the fair market value that is determined by local assessors to be the total taxable value of land and additions on the property. | Land | Improvement |
|---|---|---|---|---|
| 2023 | $2,396 | $65,620 | $8,130 | $57,490 |
| 2022 | $2,388 | $65,620 | $8,130 | $57,490 |
| 2021 | $2,325 | $55,650 | $8,130 | $47,520 |
| 2020 | $2,324 | $55,650 | $8,130 | $47,520 |
| 2019 | $2,279 | $55,650 | $8,130 | $47,520 |
| 2018 | $2,163 | $48,480 | $7,070 | $41,410 |
| 2017 | $2,165 | $48,480 | $7,070 | $41,410 |
| 2016 | $2,110 | $47,880 | $7,070 | $40,810 |
| 2015 | $1,628 | $36,200 | $5,820 | $30,380 |
| 2014 | $1,628 | $36,200 | $5,820 | $30,380 |
| 2012 | $2,123 | $46,880 | $5,820 | $41,060 |
Map
- 1645 Parkside Place
- 0 Sheridan Ave
- 1015 Sheridan Ave
- 1025 Harmon St
- 1126 Brenda Ct
- 0 E Melrose Ave
- 1920 Glenwood St
- 609 Charles Ave
- 813 Skye Dr
- 1308 Countryside Dr Unit B9
- 1013 Bernard Ave
- 614 Winfield Ave
- 901 Crystal Ave
- 1524 Plum Creek Dr
- 0 Keith Pkwy Unit 20244552
- 0 Keith Pkwy Unit 6123798
- 0 Keith Pkwy Unit 6120653
- 0 Romick Pkwy Unit 20244553
- 0 Romick Pkwy Unit 20244550
- 0 Romick Pkwy Unit 6123797