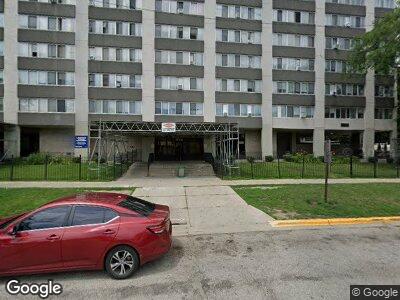
200 Julian St Waukegan, IL 60085
North Side of Little Fort NeighborhoodEstimated Value: $15,808,282
3
Beds
--
Bath
1,200
Sq Ft
$13,174/Sq Ft
Est. Value
About This Home
This home is located at 200 Julian St, Waukegan, IL 60085 and is currently estimated at $15,808,282, approximately $13,173 per square foot. 200 Julian St is a home located in Lake County with nearby schools including Edith M Smith Middle School, Waukegan High School, and Most Blessed Trinity Academy.
Create a Home Valuation Report for This Property
The Home Valuation Report is an in-depth analysis detailing your home's value as well as a comparison with similar homes in the area
Home Values in the Area
Average Home Value in this Area
Property History
| Date | Event | Price | Change | Sq Ft Price |
|---|---|---|---|---|
| 01/04/2025 01/04/25 | Off Market | $864 | -- | -- |
| 12/05/2023 12/05/23 | For Rent | $864 | -- | -- |
Tax History Compared to Growth
Tax History
| Year | Tax Paid | Tax Assessment Tax Assessment Total Assessment is a certain percentage of the fair market value that is determined by local assessors to be the total taxable value of land and additions on the property. | Land | Improvement |
|---|---|---|---|---|
| 2023 | $206,304 | $2,227,556 | $58,362 | $2,169,194 |
| 2022 | $206,304 | $2,110,306 | $56,072 | $2,054,234 |
| 2021 | $218,093 | $2,091,897 | $55,583 | $2,036,314 |
| 2020 | $222,329 | $1,948,851 | $51,782 | $1,897,069 |
| 2019 | $222,329 | $1,785,807 | $47,450 | $1,738,357 |
| 2018 | $227,696 | $1,761,151 | $46,796 | $1,714,355 |
| 2017 | $221,641 | $1,558,127 | $41,401 | $1,516,726 |
| 2016 | $209,230 | $1,353,951 | $35,976 | $1,317,975 |
| 2015 | $204,702 | $1,211,806 | $32,199 | $1,179,607 |
| 2014 | $7,612 | $1,227,146 | $32,607 | $1,194,539 |
| 2012 | $220,160 | $1,329,483 | $35,326 | $1,294,157 |
Source: Public Records
Map
Nearby Homes
- 222 Grand Ave
- 709 N County St
- 714 Grand Ave
- 522 N Poplar St
- 702 Franklin St
- 833 Hickory St
- 423 Hull Ct
- 312 Hull Ct
- 123 Philippa Ave
- 1114 Douglas Ct
- 1117 N Sheridan Rd
- 208 S Park Ave
- 1030 N Ash St
- 1014 Washington St
- 236 S Park Ave
- 932 N Jackson St
- 502 Belvidere Rd
- 1215 Hickory St
- 613 Clarke Ave
- 813 Pine St