58 Pomfret St Putnam, CT 06260
Putnam NeighborhoodAbout This Home
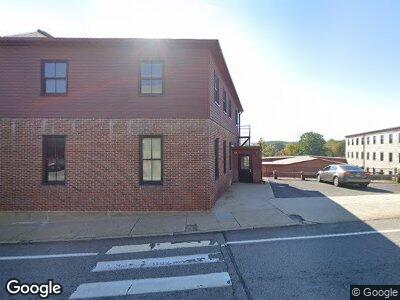
On the Quinebaug River, at the crossroads of vintage and modern flair, you’ll find historic Cargills Falls Mill in Putnam, Connecticut. Here in the heart of Putnam, is the 1807 site of one of Connecticut’s first successful cotton mills, now transformed into a unique apartment enclave. Fast-forward to the 21st Century: Putnam is a thriving, hip community with an eye to the future. This town has undergone a renaissance and attractions within walking distance include many wonderful restaurants, convenient public transportation, bakeries, antique galleries, Riverwalk, parks and more.Cargill Falls Mill has been reborn into studio, one, and two bedroom apartment homes. You will enjoy a 24-hour fitness center, a game room and community areas. Many homes have exposed brick or stone walls, natural wood beams and original wood flooring. Upgraded urban kitchens will delight your inner foodie, while large window expanses bring in plenty of natural light and scenic river views. The Lofts at Cargill Falls Mills: A Key to the Past, Unlocking the Future!
Ownership History
Purchase Details
Home Financials for this Owner
Home Financials are based on the most recent Mortgage that was taken out on this home.Home Values in the Area
Average Home Value in this Area
Purchase History
| Date | Buyer | Sale Price | Title Company |
|---|---|---|---|
| Fall Historic Cargill | $300,000 | -- |
Mortgage History
| Date | Status | Borrower | Loan Amount |
|---|---|---|---|
| Open | Mill Quinebaug River | $300,000 | |
| Closed | Mill Quinebaug River | $315,000 | |
| Previous Owner | Mill Quinebaug River | $50,000 | |
| Previous Owner | Mill Quinebaug River | $40,000 |
Property History
| Date | Event | Price | Change | Sq Ft Price |
|---|---|---|---|---|
| 03/05/2025 03/05/25 | Off Market | $1,573 | -- | -- |
| 12/09/2024 12/09/24 | Price Changed | $1,573 | -14.2% | $2 / Sq Ft |
| 09/16/2024 09/16/24 | Price Changed | $1,834 | +59.8% | $2 / Sq Ft |
| 08/07/2023 08/07/23 | For Rent | $1,148 | 0.0% | -- |
| 06/23/2023 06/23/23 | Price Changed | $1,148 | 0.0% | $2 / Sq Ft |
| 06/23/2023 06/23/23 | For Rent | $1,148 | +13.7% | -- |
| 06/15/2023 06/15/23 | For Rent | $1,010 | 0.0% | -- |
| 01/11/2023 01/11/23 | Price Changed | $1,010 | -26.0% | $1 / Sq Ft |
| 06/07/2022 06/07/22 | For Rent | $1,365 | 0.0% | -- |
| 05/20/2022 05/20/22 | For Rent | $1,365 | -- | -- |
Tax History Compared to Growth
Tax History
| Year | Tax Paid | Tax Assessment Tax Assessment Total Assessment is a certain percentage of the fair market value that is determined by local assessors to be the total taxable value of land and additions on the property. | Land | Improvement |
|---|---|---|---|---|
| 2024 | $174,306 | $5,259,700 | $217,600 | $5,042,100 |
| 2023 | $40,562 | $1,275,940 | $215,400 | $1,060,540 |
| 2022 | $23,142 | $754,060 | $215,400 | $538,660 |
| 2021 | $8,355 | $280,000 | $215,400 | $64,600 |
| 2020 | $8,355 | $280,000 | $215,500 | $64,500 |
| 2019 | $8,865 | $280,000 | $239,300 | $40,700 |
| 2018 | $8,523 | $280,000 | $239,300 | $40,700 |
| 2017 | $8,232 | $280,000 | $239,300 | $40,700 |
| 2016 | $7,403 | $280,000 | $239,300 | $40,700 |
| 2015 | $7,860 | $304,400 | $239,300 | $65,100 |
| 2014 | $9,519 | $405,600 | $239,300 | $166,300 |
Map
- 86-88 Wilkinson St
- 9999 Prospect St
- 22 Underwood Rd
- 172 Sabin St
- 50 Richmond Rd Unit 2
- 172 S Main St
- 25-27 Farrows St
- 49 Quinebaug Ave
- 88-90 Woodstock Ave
- 219 Pomfret St
- 71 Vandale St
- 61 van Den Noort St
- 21 Chassey St
- 191 Providence St
- 67 Walnut St
- 27 Nichols St
- 37 Eden St
- 68 Smith St
- 20 1/2 Cleveland St
- 72 Perry St Unit 150