901 S Navigation Blvd Corpus Christi, TX 78405
Downtown Corpus Christi NeighborhoodEstimated Value: $400,000
About This Home
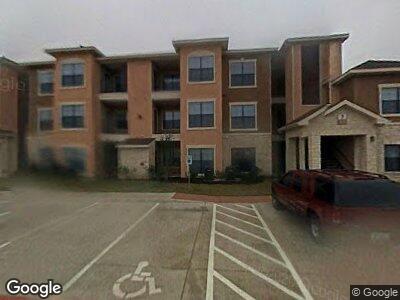
It's perfect for enjoying beach activities and exploring local eateries and stores. Whether you're in the mood for a day of relaxation by the water or a shopping excursion, Navigation Pointe provides easy access to Corpus Christi's attractions. Come experience the laid-back coastal lifestyle right at your fingertips. At Navigation Pointe apartments in Corpus Christi, TX, residents revel in many community amenities designed for relaxation and leisure. From serene spaces to recreational facilities, there's something for everyone to enjoy. Experience the convenience of on-site amenities tailored to enhance daily life, including a beach entry pool and picnic area with barbecue. Discover the vibrant atmosphere in our community.
Home Values in the Area
Average Home Value in this Area
Mortgage History
| Date | Status | Borrower | Loan Amount |
|---|---|---|---|
| Closed | Withers Family Texas Holdings Lp | $130,000 |
Property History
| Date | Event | Price | Change | Sq Ft Price |
|---|---|---|---|---|
| 07/18/2024 07/18/24 | Price Changed | $399 | -45.5% | $0 / Sq Ft |
| 07/11/2024 07/11/24 | Price Changed | $732 | +83.5% | $1 / Sq Ft |
| 06/06/2024 06/06/24 | Price Changed | $399 | +0.3% | $0 / Sq Ft |
| 02/07/2024 02/07/24 | Price Changed | $398 | 0.0% | $0 / Sq Ft |
| 02/07/2024 02/07/24 | For Rent | $398 | -0.7% | -- |
| 08/08/2023 08/08/23 | For Rent | $401 | 0.0% | -- |
| 06/21/2023 06/21/23 | For Rent | $401 | 0.0% | -- |
| 06/19/2023 06/19/23 | For Rent | $401 | 0.0% | -- |
| 03/17/2023 03/17/23 | Price Changed | $401 | -53.4% | $0 / Sq Ft |
| 09/21/2022 09/21/22 | Price Changed | $860 | +113.4% | $1 / Sq Ft |
| 06/07/2022 06/07/22 | For Rent | $403 | 0.0% | -- |
| 05/25/2022 05/25/22 | Price Changed | $403 | -14.1% | $0 / Sq Ft |
| 05/18/2022 05/18/22 | For Rent | $469 | -- | -- |
Tax History Compared to Growth
Tax History
| Year | Tax Paid | Tax Assessment Tax Assessment Total Assessment is a certain percentage of the fair market value that is determined by local assessors to be the total taxable value of land and additions on the property. | Land | Improvement |
|---|---|---|---|---|
| 2024 | $73,827 | $3,164,195 | $722,486 | $2,441,709 |
| 2023 | $85,567 | $4,000,000 | $722,486 | $3,277,514 |
| 2022 | $91,184 | $3,621,751 | $722,486 | $2,899,265 |
| 2021 | $95,725 | $3,600,882 | $722,486 | $2,878,396 |
| 2020 | $92,532 | $3,353,789 | $722,486 | $2,631,303 |
| 2019 | $95,329 | $3,418,141 | $722,486 | $2,695,655 |
| 2018 | $91,948 | $3,350,000 | $722,486 | $2,627,514 |
| 2017 | $69,873 | $2,552,689 | $722,486 | $1,830,203 |
| 2016 | $67,341 | $2,460,171 | $361,243 | $2,098,928 |
| 2015 | $23,537 | $2,280,192 | $450,480 | $1,829,712 |
| 2014 | $23,537 | $1,828,502 | $361,243 | $1,467,259 |
Map
- 122 Green Trail Dr
- 11518 Padre Island Dr N
- 4210 Archdale Dr
- 4133 Barrera Dr
- 202 Airport Rd
- 2802 Agnes St
- 4313 Molina Dr
- 1725 Cliff Maus Dr
- 1725 Rockford Dr
- 4325 Jose Dr
- 4330 Valdez Dr
- 3906 Santa Elena St
- 4406 Ramona Dr
- 4401 Valdez Dr
- 4613 Angela Dr
- 4426 Angela Dr
- 430 Pueblo St
- 3626 Fairchild St
- 3621 Curtiss St
- 1025 Beechcraft Ave