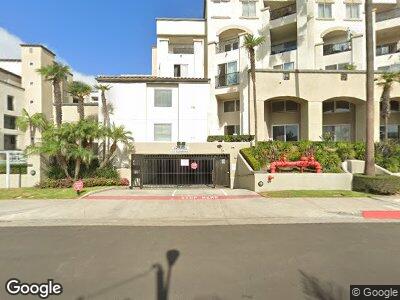
Pier Colony 200 Pacific Coast Hwy Unit 326 Huntington Beach, CA 92648
Downtown Huntington Beach NeighborhoodEstimated Value: $989,600 - $1,276,000
2
Beds
2
Baths
1,181
Sq Ft
$977/Sq Ft
Est. Value
About This Home
This home is located at 200 Pacific Coast Hwy Unit 326, Huntington Beach, CA 92648 and is currently estimated at $1,153,900, approximately $977 per square foot. 200 Pacific Coast Hwy Unit 326 is a home located in Orange County with nearby schools including Agnes L. Smith Elementary, Ethel Dwyer Middle, and Huntington Beach High School.
Ownership History
Date
Name
Owned For
Owner Type
Purchase Details
Closed on
Jan 20, 2022
Sold by
Rylski Wayne W and Rylski Theresa R
Bought by
Rylski Family Trust
Current Estimated Value
Purchase Details
Closed on
Mar 9, 1998
Sold by
Donoso Ivan R and Donoso Linda M
Bought by
Rylski Wayne W and Rylski Theresa R
Home Financials for this Owner
Home Financials are based on the most recent Mortgage that was taken out on this home.
Original Mortgage
$176,250
Interest Rate
6.99%
Purchase Details
Closed on
Apr 8, 1996
Sold by
Emc Mtg Corp
Bought by
Donoso Ivan R and Donoso Linda M
Home Financials for this Owner
Home Financials are based on the most recent Mortgage that was taken out on this home.
Original Mortgage
$207,000
Interest Rate
8.25%
Purchase Details
Closed on
Jan 2, 1996
Sold by
Great Western Bank
Bought by
Emc Mtg Corp
Create a Home Valuation Report for This Property
The Home Valuation Report is an in-depth analysis detailing your home's value as well as a comparison with similar homes in the area
Home Values in the Area
Average Home Value in this Area
Purchase History
| Date | Buyer | Sale Price | Title Company |
|---|---|---|---|
| Rylski Family Trust | -- | Chicago Title | |
| Rylski Wayne W | $235,000 | First American Title Ins Co | |
| Donoso Ivan R | $245,000 | Chicago Title Co | |
| Emc Mtg Corp | $171,000 | -- |
Source: Public Records
Mortgage History
| Date | Status | Borrower | Loan Amount |
|---|---|---|---|
| Previous Owner | Rylski Wayne W | $155,000 | |
| Previous Owner | Rylski Wayne W | $176,250 | |
| Previous Owner | Donoso Ivan R | $207,000 |
Source: Public Records
Tax History Compared to Growth
Tax History
| Year | Tax Paid | Tax Assessment Tax Assessment Total Assessment is a certain percentage of the fair market value that is determined by local assessors to be the total taxable value of land and additions on the property. | Land | Improvement |
|---|---|---|---|---|
| 2024 | $4,443 | $367,871 | $201,355 | $166,516 |
| 2023 | $4,342 | $360,658 | $197,407 | $163,251 |
| 2022 | $4,227 | $353,587 | $193,537 | $160,050 |
| 2021 | $4,150 | $346,654 | $189,742 | $156,912 |
| 2020 | $4,123 | $343,100 | $187,796 | $155,304 |
| 2019 | $4,076 | $336,373 | $184,114 | $152,259 |
| 2018 | $4,014 | $329,778 | $180,504 | $149,274 |
| 2017 | $3,961 | $323,312 | $176,964 | $146,348 |
| 2016 | $3,791 | $316,973 | $173,494 | $143,479 |
| 2015 | $3,754 | $312,212 | $170,888 | $141,324 |
| 2014 | $3,676 | $306,097 | $167,541 | $138,556 |
Source: Public Records
About Pier Colony
Map
Nearby Homes
- 200 Pacific Coast Hwy Unit 325
- 214 Walnut Ave
- 216 Walnut Ave
- 219 1st St
- 217 1st St
- 302 3rd St
- 310 2nd St
- 310 Lake St Unit 216
- 320 Lake St Unit 104
- 414 Main St Unit 415
- 414 Main St Unit 230
- 414 Main St Unit 220
- 414 Main St Unit 310
- 414 Main St Unit 205
- 414 Main St Unit 300
- 414 Main St Unit 315
- 414 Main St Unit 320
- 414 Main St Unit 210
- 311 Alabama St
- 711 Pacific Coast Hwy Unit 206