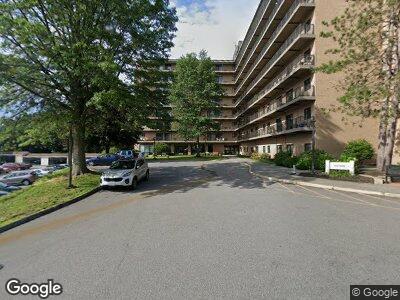
1000 Southern Artery Quincy, MA 02169
Quincy Point NeighborhoodEstimated Value: $587,996 - $720,000
1
Bed
--
Bath
500
Sq Ft
$1,308/Sq Ft
Est. Value
About This Home
Quincy Point Homes is a 62+ affordable senior community. Income qualifications must be met to qualify for an apartment home. Electric, garbage, water, heat, A/C, and sewer are included in all rents. Community amenities include an on-site senior center, a social services coordinator, a dining room, a grocery store, and a barber/beauty salon. Please call for more details or to tour today!
Ownership History
Date
Name
Owned For
Owner Type
Purchase Details
Closed on
Jan 3, 1996
Sold by
Hartford Hazel W
Bought by
1000 Southern Artery S
Current Estimated Value
Create a Home Valuation Report for This Property
The Home Valuation Report is an in-depth analysis detailing your home's value as well as a comparison with similar homes in the area
Home Values in the Area
Average Home Value in this Area
Purchase History
| Date | Buyer | Sale Price | Title Company |
|---|---|---|---|
| 1000 Southern Artery S | $150,000 | -- |
Source: Public Records
Property History
| Date | Event | Price | Change | Sq Ft Price |
|---|---|---|---|---|
| 01/04/2025 01/04/25 | Off Market | $1,558 | -- | -- |
| 04/19/2024 04/19/24 | Price Changed | $1,558 | +5.8% | $3 / Sq Ft |
| 08/07/2023 08/07/23 | For Rent | $1,473 | 0.0% | -- |
| 07/13/2023 07/13/23 | For Rent | $1,473 | 0.0% | -- |
| 06/14/2023 06/14/23 | For Rent | $1,473 | 0.0% | -- |
| 02/22/2023 02/22/23 | Price Changed | $1,473 | +4.5% | $3 / Sq Ft |
| 08/23/2022 08/23/22 | For Rent | $1,410 | -- | -- |
Tax History Compared to Growth
Tax History
| Year | Tax Paid | Tax Assessment Tax Assessment Total Assessment is a certain percentage of the fair market value that is determined by local assessors to be the total taxable value of land and additions on the property. | Land | Improvement |
|---|---|---|---|---|
| 2025 | $3,532 | $306,300 | $293,800 | $12,500 |
| 2024 | $3,127 | $277,500 | $265,000 | $12,500 |
| 2023 | $2,836 | $254,800 | $242,300 | $12,500 |
| 2022 | $2,806 | $234,200 | $221,700 | $12,500 |
| 2021 | $2,843 | $234,200 | $221,700 | $12,500 |
| 2020 | $2,612 | $210,100 | $197,600 | $12,500 |
| 2019 | $2,466 | $196,500 | $184,000 | $12,500 |
| 2018 | $2,556 | $191,600 | $179,100 | $12,500 |
| 2017 | $2,604 | $183,800 | $171,300 | $12,500 |
| 2016 | $2,542 | $177,000 | $164,500 | $12,500 |
| 2015 | $2,537 | $173,800 | $161,300 | $12,500 |
| 2014 | $2,440 | $164,200 | $157,900 | $6,300 |
Source: Public Records
Map
Nearby Homes
- 35 Desmoines Rd Unit 210
- 488 Quincy Ave Unit 2
- 488 Quincy Ave Unit 8
- 488 Quincy Ave Unit 7
- 15 Broadway Unit 15
- 26 Lawrence St
- 934 Southern Artery Unit 214
- 200 Falls Blvd Unit D108
- 7 Burns Ave
- 59 Germain Ave
- 111 Arnold St
- 91 Curtis Ave
- 15 Baxter Ave
- 33 Curtis Ave
- 178 South St Unit 5
- 51 Sumner St
- 18 Lawn Ave
- 38-40 Lawn Ave
- 161 Sumner St Unit 3
- 32 Sumner St