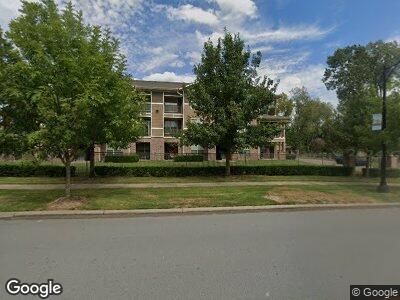
1601 Rockwater Blvd North Little Rock, AR 72114
Baring Cross NeighborhoodEstimated Value: $314,000
--
Bed
--
Bath
41,925
Sq Ft
$7/Sq Ft
Est. Value
About This Home
This home is located at 1601 Rockwater Blvd, North Little Rock, AR 72114 and is currently priced at $314,000, approximately $7 per square foot. 1601 Rockwater Blvd is a home located in Pulaski County with nearby schools including Boone Park Elementary School, North Little Rock Middle School 6th Grade Campus, and North Little Rock High School.
Ownership History
Date
Name
Owned For
Owner Type
Purchase Details
Closed on
Mar 4, 2019
Sold by
Wabu Properties Llc
Bought by
Neill Jeffrey A
Current Estimated Value
Purchase Details
Closed on
Dec 6, 2017
Sold by
North Bluffs Development Corp
Bought by
Wabu Properties Llc
Home Financials for this Owner
Home Financials are based on the most recent Mortgage that was taken out on this home.
Original Mortgage
$383,000
Interest Rate
3.94%
Mortgage Type
Construction
Purchase Details
Closed on
Apr 11, 2011
Sold by
North Bluffs Development Corporation
Bought by
Post Little Rock Apartments Llc
Home Financials for this Owner
Home Financials are based on the most recent Mortgage that was taken out on this home.
Original Mortgage
$20,250,000
Interest Rate
4.37%
Mortgage Type
FHA
Create a Home Valuation Report for This Property
The Home Valuation Report is an in-depth analysis detailing your home's value as well as a comparison with similar homes in the area
Home Values in the Area
Average Home Value in this Area
Purchase History
| Date | Buyer | Sale Price | Title Company |
|---|---|---|---|
| Wabu Properties Llc | $100,000 | American Abstract & Title Co | |
| Post Little Rock Apartments Llc | $1,841,000 | Lenders Title Company |
Source: Public Records
Mortgage History
| Date | Status | Borrower | Loan Amount |
|---|---|---|---|
| Open | Post Little Rock Apartments Llc | $28,000,000 | |
| Previous Owner | Wabu Properties Llc | $383,000 | |
| Previous Owner | Post Little Rock Apartments Llc | $20,250,000 | |
| Previous Owner | Post Little Rock Apartments Llc | $20,250,000 |
Source: Public Records
Tax History Compared to Growth
Tax History
| Year | Tax Paid | Tax Assessment Tax Assessment Total Assessment is a certain percentage of the fair market value that is determined by local assessors to be the total taxable value of land and additions on the property. | Land | Improvement |
|---|---|---|---|---|
| 2023 | $403,221 | $6,302,000 | $339,768 | $5,962,232 |
| 2022 | $387,503 | $6,302,000 | $339,768 | $5,962,232 |
| 2021 | $353,901 | $5,030,200 | $339,770 | $4,690,430 |
| 2020 | $353,901 | $5,030,200 | $339,770 | $4,690,430 |
| 2019 | $331,861 | $5,030,200 | $339,770 | $4,690,430 |
| 2018 | $307,709 | $5,030,200 | $339,770 | $4,690,430 |
| 2017 | $283,557 | $5,030,200 | $339,770 | $4,690,430 |
| 2016 | $241,520 | $3,615,576 | $339,770 | $3,275,806 |
| 2015 | $257,740 | $3,858,390 | $339,770 | $3,518,620 |
| 2014 | $257,740 | $3,858,390 | $339,770 | $3,518,620 |
Source: Public Records
Map
Nearby Homes
- 1509 Nanterre St
- 1505 Nanterre St
- 1500 Nanterre St
- 1501 Nanterre St
- 1417 Nanterre St
- 1412 Nanterre St
- 1409 Nanterre St
- 1419 Rockwater Blvd
- Lot 24 Nanterre
- 1401 Nanterre St
- 1400 Nanterre St
- 432 Gardens Ln
- 424 Gardens Ln
- 420 Gardens Ln
- 416 Gardens Ln
- 408 Gardens Ln
- 1301 Rockwater Ln
- 1209 W 7th St
- 1207 W 7th St
- 403 Parker St