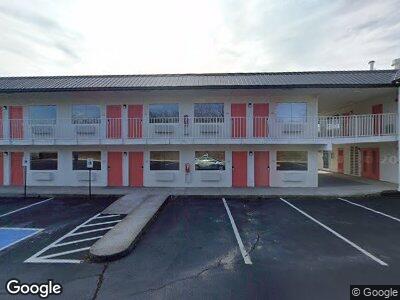
311 W Trinity Ln Nashville, TN 37207
Talbot's Corner NeighborhoodEstimated Value: $16,463,435
--
Bed
1
Bath
240
Sq Ft
$68,598/Sq Ft
Est. Value
About This Home
This home is located at 311 W Trinity Ln, Nashville, TN 37207 and is currently estimated at $16,463,435, approximately $68,597 per square foot. 311 W Trinity Ln is a home located in Davidson County with nearby schools including Alex Green Elementary School, Haynes Middle, and Brick Church Middle School.
Ownership History
Date
Name
Owned For
Owner Type
Purchase Details
Closed on
Nov 5, 2021
Sold by
311 W Trinity Investor Llc
Bought by
Sohana Apartments Llc
Current Estimated Value
Home Financials for this Owner
Home Financials are based on the most recent Mortgage that was taken out on this home.
Original Mortgage
$10,875,000
Interest Rate
2.88%
Mortgage Type
Purchase Money Mortgage
Purchase Details
Closed on
May 10, 2019
Sold by
Shriji Hospitality Inc
Bought by
311 W Trinity Investor Llc
Home Financials for this Owner
Home Financials are based on the most recent Mortgage that was taken out on this home.
Original Mortgage
$4,000,000
Interest Rate
4%
Mortgage Type
Purchase Money Mortgage
Create a Home Valuation Report for This Property
The Home Valuation Report is an in-depth analysis detailing your home's value as well as a comparison with similar homes in the area
Home Values in the Area
Average Home Value in this Area
Purchase History
| Date | Buyer | Sale Price | Title Company |
|---|---|---|---|
| Sohana Apartments Llc | $14,000,000 | None Available | |
| 311 W Trinity Investor Llc | $4,300,000 | Rudy Title And Escrow Llc |
Source: Public Records
Mortgage History
| Date | Status | Borrower | Loan Amount |
|---|---|---|---|
| Open | Sohana Apartments Llc | $11,200,000 | |
| Closed | Sohana Apartments Llc | $10,875,000 | |
| Previous Owner | 311 W Trinity Investor Llc | $5,919,000 | |
| Previous Owner | 311 W Trinity Investor Llc | $4,000,000 |
Source: Public Records
Tax History Compared to Growth
Tax History
| Year | Tax Paid | Tax Assessment Tax Assessment Total Assessment is a certain percentage of the fair market value that is determined by local assessors to be the total taxable value of land and additions on the property. | Land | Improvement |
|---|---|---|---|---|
| 2024 | $45,655 | $1,403,040 | $292,320 | $1,110,720 |
| 2023 | $45,655 | $1,403,040 | $292,320 | $1,110,720 |
| 2022 | $45,655 | $1,403,040 | $292,320 | $1,110,720 |
| 2021 | $46,132 | $1,403,040 | $292,320 | $1,110,720 |
| 2020 | $61,810 | $1,136,560 | $259,840 | $876,720 |
| 2019 | $35,858 | $1,136,560 | $259,840 | $876,720 |
| 2018 | $35,858 | $1,136,560 | $259,840 | $876,720 |
| 2017 | $35,858 | $1,136,560 | $259,840 | $876,720 |
| 2016 | $21,505 | $476,200 | $162,400 | $313,800 |
| 2015 | $21,505 | $476,200 | $162,400 | $313,800 |
| 2014 | $21,505 | $476,200 | $162,400 | $313,800 |
Source: Public Records
Map
Nearby Homes
- 1209 Avondale Cir
- 1227 N Avondale Cir
- 1229 N Avondale Cir
- 1617 Hampton St
- 0 Monticello Dr
- 123 Ventura Way
- 224 Twilight Ln
- 226 Twilight Ln
- 222 Twilight Ln
- 228 Twilight Ln
- 121 Ventura Way
- 230 Twilight Ln
- 130 Ventura Way
- 126 Ventura Way
- 0 W Trinity Ln
- 421 Monticello St
- 948 Chloe Cir Unit 1
- 946 Chloe Cir Unit 2
- 445 Dennis Dr
- 442 Roger Williams Ave