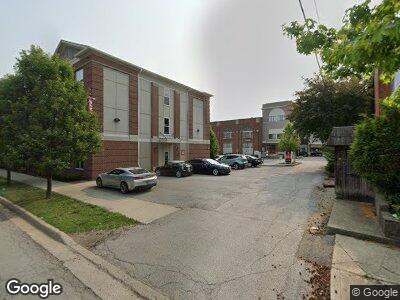
315 N Lebanon St Lebanon, IN 46052
2
Beds
--
Bath
860
Sq Ft
0.89
Acres
About This Home
Currently renovating every unit in this building! All units will be updated. This amazing historical building will be taking on a new face. Our courtyard area for residents has patio furniture and a grill for tenants to use! Why not utilize our amazing outdoor spaces, by creating areas for residents and their guest! Brand new fitness center open to residents! We also have two new buildings that were built in 2016.
Ownership History
Date
Name
Owned For
Owner Type
Purchase Details
Closed on
Feb 13, 2020
Sold by
Iron Men Properties Of Lebanon I Llc
Bought by
Pc Flats Llc
Create a Home Valuation Report for This Property
The Home Valuation Report is an in-depth analysis detailing your home's value as well as a comparison with similar homes in the area
Home Values in the Area
Average Home Value in this Area
Purchase History
| Date | Buyer | Sale Price | Title Company |
|---|---|---|---|
| Pc Flats Llc | -- | None Available |
Source: Public Records
Property History
| Date | Event | Price | Change | Sq Ft Price |
|---|---|---|---|---|
| 02/26/2024 02/26/24 | Price Changed | $780 | -1.3% | $2 / Sq Ft |
| 08/07/2023 08/07/23 | For Rent | $790 | 0.0% | -- |
| 06/21/2023 06/21/23 | For Rent | $790 | 0.0% | -- |
| 03/24/2023 03/24/23 | Price Changed | $790 | +8.2% | $2 / Sq Ft |
| 06/07/2022 06/07/22 | For Rent | $730 | 0.0% | -- |
| 05/25/2022 05/25/22 | Price Changed | $730 | -7.0% | $2 / Sq Ft |
| 05/20/2022 05/20/22 | For Rent | $785 | -- | -- |
Tax History Compared to Growth
Tax History
| Year | Tax Paid | Tax Assessment Tax Assessment Total Assessment is a certain percentage of the fair market value that is determined by local assessors to be the total taxable value of land and additions on the property. | Land | Improvement |
|---|---|---|---|---|
| 2024 | $57,769 | $2,935,600 | $97,300 | $2,838,300 |
| 2023 | $57,769 | $2,794,000 | $97,300 | $2,696,700 |
| 2022 | $55,172 | $2,717,500 | $102,300 | $2,615,200 |
| 2021 | $54,932 | $2,782,100 | $102,300 | $2,679,800 |
| 2020 | $31,244 | $1,475,100 | $102,300 | $1,372,800 |
| 2019 | $29,314 | $1,446,200 | $102,300 | $1,343,900 |
| 2018 | $29,855 | $1,378,600 | $102,300 | $1,276,300 |
| 2017 | $28,704 | $1,351,600 | $102,300 | $1,249,300 |
Source: Public Records
Map
Nearby Homes