111 Loganberry St Lake Jackson, TX 77566
4
Beds
--
Bath
1,338
Sq Ft
14
Acres
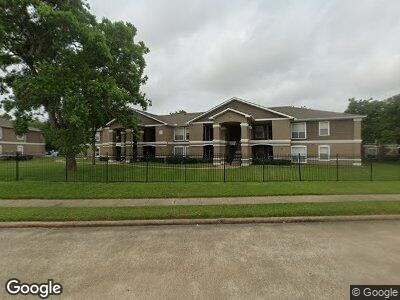
About This Home
The Gateway at Lake Jackson apartments is a newly renovated apartment community situated on 11 acres in the heart of Lake Jackson. Our community offers everything you need for comfort and convenience, including barbecue areas, fitness center, resort-style swimming pool, clubhouse and so much more! Select from 1-2-3 or 4 bedroom energy efficient apartment homes with many upgrades to make your daily living a breeze!
Ownership History
Date
Name
Owned For
Owner Type
Purchase Details
Closed on
Aug 24, 2022
Sold by
Gateway Lake Jackson Owner Lp
Bought by
Gateway Lake Jackson Preservation Llc
Purchase Details
Closed on
Mar 14, 2019
Sold by
Gateway Housing Llc
Bought by
Gateway Preservation Lp
Home Financials for this Owner
Home Financials are based on the most recent Mortgage that was taken out on this home.
Original Mortgage
$5,627,000
Interest Rate
4.4%
Mortgage Type
Commercial
Create a Home Valuation Report for This Property
The Home Valuation Report is an in-depth analysis detailing your home's value as well as a comparison with similar homes in the area
Home Values in the Area
Average Home Value in this Area
Purchase History
| Date | Buyer | Sale Price | Title Company |
|---|---|---|---|
| Gateway Lake Jackson Preservation Llc | -- | None Listed On Document | |
| Gateway Preservation Lp | -- | Riverway Title |
Source: Public Records
Mortgage History
| Date | Status | Borrower | Loan Amount |
|---|---|---|---|
| Previous Owner | Gateway Preservation Lp | $5,627,000 |
Source: Public Records
Property History
| Date | Event | Price | Change | Sq Ft Price |
|---|---|---|---|---|
| 07/15/2023 07/15/23 | Price Changed | $999 | +8.8% | $1 / Sq Ft |
| 06/24/2023 06/24/23 | For Rent | $918 | 0.0% | -- |
| 04/29/2023 04/29/23 | Price Changed | $918 | -15.5% | $1 / Sq Ft |
| 04/18/2023 04/18/23 | Price Changed | $1,086 | +18.3% | $2 / Sq Ft |
| 04/13/2023 04/13/23 | Price Changed | $918 | -15.5% | $1 / Sq Ft |
| 03/23/2023 03/23/23 | Price Changed | $1,086 | +18.3% | $2 / Sq Ft |
| 08/23/2022 08/23/22 | Price Changed | $918 | -23.4% | $1 / Sq Ft |
| 08/17/2022 08/17/22 | Price Changed | $1,199 | +20.0% | $2 / Sq Ft |
| 07/27/2022 07/27/22 | For Rent | $999 | -- | -- |
Tax History Compared to Growth
Tax History
| Year | Tax Paid | Tax Assessment Tax Assessment Total Assessment is a certain percentage of the fair market value that is determined by local assessors to be the total taxable value of land and additions on the property. | Land | Improvement |
|---|---|---|---|---|
| 2023 | $167,045 | $8,599,270 | $1,617,300 | $6,981,970 |
| 2022 | $112,246 | $5,119,290 | $1,244,070 | $3,875,220 |
| 2021 | $99,611 | $4,295,760 | $1,244,070 | $3,051,690 |
| 2020 | $157,516 | $6,636,270 | $1,244,070 | $5,392,200 |
| 2019 | $127,734 | $5,232,580 | $1,244,070 | $3,988,510 |
| 2018 | $128,585 | $5,224,080 | $1,244,070 | $3,980,010 |
| 2017 | $166,191 | $6,737,000 | $1,244,070 | $5,492,930 |
| 2016 | $163,707 | $6,636,270 | $1,244,070 | $5,392,200 |
| 2015 | -- | $6,636,270 | $1,244,070 | $5,392,200 |
| 2014 | -- | $6,636,270 | $1,244,070 | $5,392,200 |
Source: Public Records
Map
Nearby Homes
- 114 Flag Dr W
- 105 Poinciana St
- 704 Walnut St
- 1007 Oleander St
- 935 Magnolia St
- 116 Balsam St
- 303 Balsam St
- 910 Magnolia St
- 125 Spruce St
- 207 Cypress St
- 223 Silverbell Cir
- 418 Garland Dr Unit 231
- 418 Garland Dr Unit 222
- 105 Forest Oaks Ln
- 107 Forest Oaks Ln
- 204 Caladium St
- 120 Silverbell Cir
- 418 Oleander St
- 312 Narcissus St
- 52 Michelia Ct