5001 N Mesa St El Paso, TX 79912
Mesa Hills Neighborhood
2
Beds
--
Bath
1,218
Sq Ft
4.68
Acres
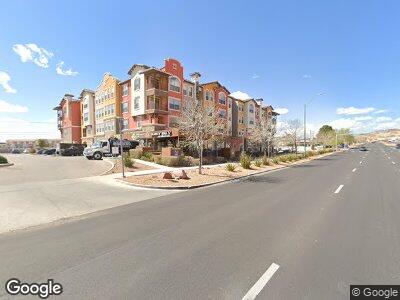
About This Home
The Venue at Montecillo has the three greatest features any apartment community can offer: location, location, location. Situated near shopping, entertainment, and transportation, The Venue at Montecillo is the perfect place to call home. Enjoy our swimming pool, clubhouse, and storage space. The comforts of our spacious apartments will suit your every need. The Venue at Montecillo's has the combination of modern architectural design, best-in-class finishes, attractive resident amenity package and rich urban, Westside location make it one of the most desirable and prestigious communities in El Paso.
Ownership History
Date
Name
Owned For
Owner Type
Purchase Details
Closed on
Apr 5, 2011
Sold by
Ept Mesa Development Lp
Bought by
Ept The Venue At Montecillo Apartments L
Create a Home Valuation Report for This Property
The Home Valuation Report is an in-depth analysis detailing your home's value as well as a comparison with similar homes in the area
Home Values in the Area
Average Home Value in this Area
Purchase History
| Date | Buyer | Sale Price | Title Company |
|---|---|---|---|
| Ept The Venue At Montecillo Apartments L | -- | None Available |
Source: Public Records
Property History
| Date | Event | Price | Change | Sq Ft Price |
|---|---|---|---|---|
| 08/08/2023 08/08/23 | For Rent | $1,229 | 0.0% | -- |
| 07/24/2023 07/24/23 | Price Changed | $1,229 | -2.7% | $2 / Sq Ft |
| 07/21/2023 07/21/23 | Price Changed | $1,263 | -2.3% | $2 / Sq Ft |
| 06/23/2023 06/23/23 | Price Changed | $1,293 | +2.7% | $2 / Sq Ft |
| 06/22/2023 06/22/23 | Price Changed | $1,259 | -2.6% | $2 / Sq Ft |
| 06/22/2023 06/22/23 | Price Changed | $1,293 | +2.4% | $2 / Sq Ft |
| 06/21/2023 06/21/23 | For Rent | $1,263 | 0.0% | -- |
| 05/05/2023 05/05/23 | Price Changed | $1,263 | +13.4% | $2 / Sq Ft |
| 01/25/2023 01/25/23 | Price Changed | $1,114 | -4.2% | $2 / Sq Ft |
| 01/19/2023 01/19/23 | Price Changed | $1,163 | +4.4% | $2 / Sq Ft |
| 01/13/2023 01/13/23 | Price Changed | $1,114 | -4.2% | $2 / Sq Ft |
| 12/28/2022 12/28/22 | Price Changed | $1,163 | +4.4% | $2 / Sq Ft |
| 11/22/2022 11/22/22 | Price Changed | $1,114 | -4.2% | $2 / Sq Ft |
| 11/10/2022 11/10/22 | Price Changed | $1,163 | +6.3% | $2 / Sq Ft |
| 09/20/2022 09/20/22 | Price Changed | $1,094 | -5.9% | $2 / Sq Ft |
| 08/06/2022 08/06/22 | Price Changed | $1,163 | +6.3% | $2 / Sq Ft |
| 07/02/2022 07/02/22 | Price Changed | $1,094 | -3.0% | $2 / Sq Ft |
| 06/09/2022 06/09/22 | Price Changed | $1,128 | +4.5% | $2 / Sq Ft |
| 06/07/2022 06/07/22 | For Rent | $1,079 | 0.0% | -- |
| 05/18/2022 05/18/22 | For Rent | $1,079 | -- | -- |
Tax History Compared to Growth
Tax History
| Year | Tax Paid | Tax Assessment Tax Assessment Total Assessment is a certain percentage of the fair market value that is determined by local assessors to be the total taxable value of land and additions on the property. | Land | Improvement |
|---|---|---|---|---|
| 2023 | $407,247 | $14,722,096 | $1,687,823 | $13,034,273 |
| 2022 | $435,796 | $14,722,096 | $1,687,823 | $13,034,273 |
| 2021 | $389,669 | $10,319,092 | $1,687,823 | $8,631,269 |
| 2020 | $383,592 | $12,480,387 | $1,687,823 | $10,792,564 |
| 2018 | $307,541 | $10,390,913 | $1,687,823 | $8,703,090 |
| 2017 | $375,569 | $13,333,577 | $1,687,823 | $11,645,754 |
| 2016 | $374,300 | $13,288,524 | $1,687,823 | $11,600,701 |
| 2015 | $277,605 | $12,221,716 | $1,687,823 | $10,533,893 |
| 2014 | $277,605 | $10,145,344 | $1,687,823 | $8,457,521 |
Source: Public Records
Map
Nearby Homes
- 333 Vin Almoradi Ct
- 337 Vin Almoradi Ct
- 144 Mardi Gras Dr
- 301 Mardi Gras Dr
- 331 Carnival Dr
- 4836 Excalibur Dr
- 4433 N Stanton St Unit 304
- 4433 N Stanton St Unit 37
- 4433 N Stanton St Unit P 358
- 287 Everest Dr
- 4800 N Stanton St Unit 137
- 4800 N Stanton St Unit 93
- 4800 N Stanton St Unit 105
- 4800 N Stanton St Unit 147
- 5264 Jose Cardenas Ln
- 4332 Buckingham Dr
- 5567 Buckley Dr
- 5566 Buckley Dr
- 378 Pleasant View Ct
- 4313 Okeefe Dr