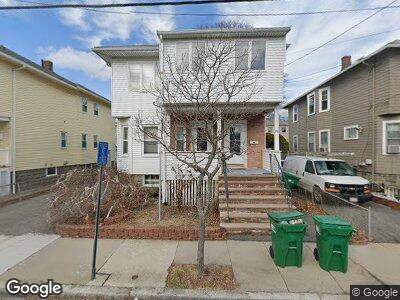
89 Frederick Ave Medford, MA 02155
South Medford NeighborhoodEstimated Value: $873,340 - $1,138,000
3
Beds
1
Bath
--
Sq Ft
3,354
Sq Ft Lot
About This Home
This home is located at 89 Frederick Ave, Medford, MA 02155 and is currently estimated at $980,085. 89 Frederick Ave is a home located in Middlesex County with nearby schools including Medford High School, St. Clement Elementary School, and St. Joseph School.
Ownership History
Date
Name
Owned For
Owner Type
Purchase Details
Closed on
Sep 17, 2018
Sold by
Small Linda J and Miller Bruce
Bought by
10 Putnam Street Rt
Current Estimated Value
Home Financials for this Owner
Home Financials are based on the most recent Mortgage that was taken out on this home.
Original Mortgage
$667,000
Interest Rate
4.6%
Mortgage Type
Unknown
Purchase Details
Closed on
Dec 13, 2005
Sold by
Miller Don P
Bought by
Miller Bruce and Miller Don P
Create a Home Valuation Report for This Property
The Home Valuation Report is an in-depth analysis detailing your home's value as well as a comparison with similar homes in the area
Home Values in the Area
Average Home Value in this Area
Purchase History
| Date | Buyer | Sale Price | Title Company |
|---|---|---|---|
| 10 Putnam Street Rt | $816,000 | -- | |
| Miller Bruce | -- | -- |
Source: Public Records
Mortgage History
| Date | Status | Borrower | Loan Amount |
|---|---|---|---|
| Open | 10 Putnam St Rt | $3,265,000 | |
| Closed | 10 Putnam St Rt | $1,000,000 | |
| Closed | 10 Putnam Street Rt | $667,000 |
Source: Public Records
Tax History Compared to Growth
Tax History
| Year | Tax Paid | Tax Assessment Tax Assessment Total Assessment is a certain percentage of the fair market value that is determined by local assessors to be the total taxable value of land and additions on the property. | Land | Improvement |
|---|---|---|---|---|
| 2025 | $6,412 | $752,600 | $299,600 | $453,000 |
| 2024 | $6,412 | $752,600 | $299,600 | $453,000 |
| 2023 | $6,273 | $725,200 | $280,000 | $445,200 |
| 2022 | $6,305 | $699,800 | $254,600 | $445,200 |
| 2021 | $5,946 | $631,900 | $242,500 | $389,400 |
| 2020 | $5,858 | $638,100 | $242,500 | $395,600 |
| 2019 | $5,526 | $575,600 | $220,400 | $355,200 |
| 2018 | $5,255 | $513,200 | $200,400 | $312,800 |
| 2017 | $4,934 | $467,200 | $187,300 | $279,900 |
| 2016 | $4,467 | $399,200 | $170,300 | $228,900 |
| 2015 | $4,237 | $362,100 | $162,200 | $199,900 |
Source: Public Records
Map
Nearby Homes
- 79 Windsor Rd
- 30 George St
- 297 Main St Unit 3
- 86 George St Unit 88
- 168 Main St Unit B
- 168 Main St Unit A
- 168 Main St
- 215 Harvard St Unit 24
- 11 Bonner Ave Unit 1
- 154 Summer St Unit 154
- 11 Orchard St Unit 2
- 39 Bonner Ave Unit 2
- 39 Bonner Ave Unit 1
- 43 Mayberry Ave
- 30 Main St Unit 4
- 15 Upland Rd
- 34 Salem St Unit 301
- 52 Lyman Ave Unit 2
- 47 Walker St
- 35 Teele Ave Unit 35