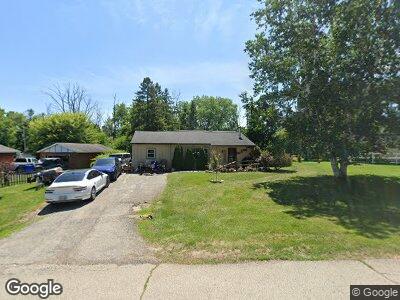
W146S7003 Catalina Dr Muskego, WI 53150
Estimated Value: $306,000 - $401,000
--
Bed
--
Bath
1,687
Sq Ft
$207/Sq Ft
Est. Value
About This Home
This home is located at W146S7003 Catalina Dr, Muskego, WI 53150 and is currently estimated at $349,536, approximately $207 per square foot. W146S7003 Catalina Dr is a home located in Waukesha County with nearby schools including Bay Lane Elementary School, Lake Denoon Middle School, and Muskego High School.
Ownership History
Date
Name
Owned For
Owner Type
Purchase Details
Closed on
Sep 6, 2018
Sold by
Henneberry Deanne M and Henneberry Craig T
Bought by
Henneberry Craig T and Henneberry Deanne M
Current Estimated Value
Home Financials for this Owner
Home Financials are based on the most recent Mortgage that was taken out on this home.
Original Mortgage
$165,000
Outstanding Balance
$145,931
Interest Rate
4.6%
Mortgage Type
New Conventional
Estimated Equity
$203,405
Purchase Details
Closed on
Nov 30, 2010
Sold by
Wene Deborah A
Bought by
Schneider Deanne M
Home Financials for this Owner
Home Financials are based on the most recent Mortgage that was taken out on this home.
Original Mortgage
$146,197
Interest Rate
4.5%
Mortgage Type
FHA
Purchase Details
Closed on
Dec 10, 1998
Sold by
Wene Richard L
Bought by
Wene Deborah A
Create a Home Valuation Report for This Property
The Home Valuation Report is an in-depth analysis detailing your home's value as well as a comparison with similar homes in the area
Home Values in the Area
Average Home Value in this Area
Purchase History
| Date | Buyer | Sale Price | Title Company |
|---|---|---|---|
| Henneberry Craig T | -- | None Available | |
| Schneider Deanne M | $150,000 | None Available | |
| Wene Deborah A | -- | -- |
Source: Public Records
Mortgage History
| Date | Status | Borrower | Loan Amount |
|---|---|---|---|
| Open | Henneberry Craig T | $48,000 | |
| Open | Henneberry Craig T | $165,000 | |
| Closed | Schneider Deanne M | $146,197 | |
| Previous Owner | Wene Deborah A | $111,100 | |
| Previous Owner | Wene Deborah A | $35,000 | |
| Previous Owner | Wene Deborah A | $56,000 | |
| Previous Owner | Wene Deborah A | $40,000 |
Source: Public Records
Tax History Compared to Growth
Tax History
| Year | Tax Paid | Tax Assessment Tax Assessment Total Assessment is a certain percentage of the fair market value that is determined by local assessors to be the total taxable value of land and additions on the property. | Land | Improvement |
|---|---|---|---|---|
| 2024 | $3,337 | $216,800 | $76,900 | $139,900 |
| 2023 | $2,345 | $216,800 | $76,900 | $139,900 |
| 2022 | $2,752 | $216,800 | $76,900 | $139,900 |
| 2021 | $3,126 | $216,800 | $76,900 | $139,900 |
| 2020 | $3,302 | $179,900 | $66,800 | $113,100 |
| 2019 | $3,313 | $179,900 | $66,800 | $113,100 |
| 2018 | $3,336 | $179,900 | $66,800 | $113,100 |
| 2017 | $2,937 | $179,900 | $66,800 | $113,100 |
| 2016 | $2,304 | $152,500 | $63,300 | $89,200 |
| 2015 | $2,670 | $152,500 | $63,300 | $89,200 |
| 2014 | $2,542 | $152,500 | $63,300 | $89,200 |
| 2013 | $2,542 | $152,500 | $63,300 | $89,200 |
Source: Public Records
Map
Nearby Homes
- S69W14828 Dartmouth Cir
- W142S6930 Belmont Dr
- W150S7174 Westcot Dr
- Lt7 Twin Silos Ct
- Lt6 Twin Silos Ct
- Lt4 Twin Silos Ct
- Lt9 Twin Silos Ct
- Lt5 Twin Silos Ct
- Lt3 Twin Silos Ct
- Lt2 Twin Silos Ct
- Lt8 Twin Silos Ct
- Lt1 Twin Silos Ct
- W155S7039 Sandalwood Cir Unit 1
- W138S6655 Hemming Way
- W154S7327 Westfield Way
- S73W15444 Cherrywood Ct
- Lt17 W Old Farm Rd
- S75W13399 Courtland Ln
- Lt2 Windsor Rd
- 13645 W Sunbury Rd