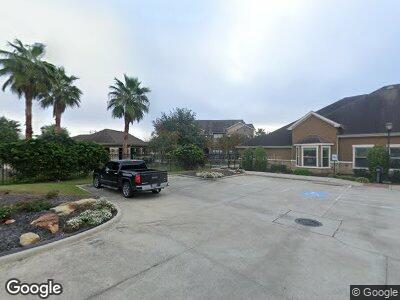
2111 Old Holzwarth Rd Spring, TX 77388
Champions NeighborhoodEstimated Value: $67,911,052
3
Beds
--
Bath
1,523
Sq Ft
$44,590/Sq Ft
Est. Value
About This Home
This home is located at 2111 Old Holzwarth Rd, Spring, TX 77388 and is currently estimated at $67,911,052, approximately $44,590 per square foot. 2111 Old Holzwarth Rd is a home located in Harris County with nearby schools including Salyers Elementary School, Springwoods Village Middle School, and Spring High School.
Ownership History
Date
Name
Owned For
Owner Type
Purchase Details
Closed on
May 6, 2022
Sold by
Mref Ii Waterstone Llc
Bought by
2111 Waterstone Limited Partnership
Current Estimated Value
Home Financials for this Owner
Home Financials are based on the most recent Mortgage that was taken out on this home.
Original Mortgage
$53,050,000
Outstanding Balance
$50,902,250
Interest Rate
5.27%
Mortgage Type
New Conventional
Estimated Equity
$17,183,046
Purchase Details
Closed on
Sep 1, 2015
Sold by
Holzwarth Partners Llc
Bought by
Mref Ii Waterstone Llc
Create a Home Valuation Report for This Property
The Home Valuation Report is an in-depth analysis detailing your home's value as well as a comparison with similar homes in the area
Home Values in the Area
Average Home Value in this Area
Purchase History
| Date | Buyer | Sale Price | Title Company |
|---|---|---|---|
| 2111 Waterstone Limited Partnership | -- | None Listed On Document | |
| Mref Ii Waterstone Llc | $42,000,000 | Stewart Title |
Source: Public Records
Mortgage History
| Date | Status | Borrower | Loan Amount |
|---|---|---|---|
| Open | 2111 Waterstone Limited Partnership | $53,050,000 |
Source: Public Records
Property History
| Date | Event | Price | Change | Sq Ft Price |
|---|---|---|---|---|
| 03/10/2025 03/10/25 | Off Market | $1,299 | -- | -- |
| 03/06/2025 03/06/25 | Price Changed | $1,299 | -6.9% | $2 / Sq Ft |
| 03/05/2025 03/05/25 | Price Changed | $1,395 | +3.4% | $2 / Sq Ft |
| 02/27/2025 02/27/25 | Price Changed | $1,349 | +3.8% | $2 / Sq Ft |
| 02/14/2025 02/14/25 | Price Changed | $1,299 | -3.8% | $2 / Sq Ft |
| 02/08/2025 02/08/25 | Price Changed | $1,350 | +3.9% | $2 / Sq Ft |
| 02/03/2025 02/03/25 | Price Changed | $1,299 | -8.2% | $2 / Sq Ft |
| 02/02/2025 02/02/25 | Price Changed | $1,415 | +8.9% | $2 / Sq Ft |
| 01/04/2025 01/04/25 | Price Changed | $1,299 | +0.3% | $2 / Sq Ft |
| 12/19/2024 12/19/24 | Price Changed | $1,295 | -4.1% | $2 / Sq Ft |
| 12/18/2024 12/18/24 | Price Changed | $1,350 | +8.9% | $2 / Sq Ft |
| 12/04/2024 12/04/24 | Price Changed | $1,240 | -4.3% | $2 / Sq Ft |
| 11/15/2024 11/15/24 | Price Changed | $1,296 | +0.1% | $2 / Sq Ft |
| 11/13/2024 11/13/24 | Price Changed | $1,295 | -2.6% | $2 / Sq Ft |
| 09/14/2024 09/14/24 | Price Changed | $1,329 | +0.8% | $2 / Sq Ft |
| 09/10/2024 09/10/24 | Price Changed | $1,319 | -2.9% | $2 / Sq Ft |
| 07/03/2024 07/03/24 | Price Changed | $1,359 | -5.3% | $2 / Sq Ft |
| 07/02/2024 07/02/24 | Price Changed | $1,435 | +6.4% | $2 / Sq Ft |
| 06/29/2024 06/29/24 | Price Changed | $1,349 | -1.9% | $2 / Sq Ft |
| 05/18/2024 05/18/24 | Price Changed | $1,375 | +7.8% | $2 / Sq Ft |
| 05/10/2024 05/10/24 | Price Changed | $1,275 | -3.8% | $2 / Sq Ft |
| 05/03/2024 05/03/24 | Price Changed | $1,325 | -4.3% | $2 / Sq Ft |
| 04/30/2024 04/30/24 | Price Changed | $1,385 | -2.1% | $2 / Sq Ft |
| 04/28/2024 04/28/24 | Price Changed | $1,415 | +4.8% | $2 / Sq Ft |
| 04/26/2024 04/26/24 | Price Changed | $1,350 | 0.0% | $2 / Sq Ft |
| 04/26/2024 04/26/24 | For Rent | $1,350 | -4.2% | -- |
| 03/02/2024 03/02/24 | Price Changed | $1,409 | +5.9% | $2 / Sq Ft |
| 02/28/2024 02/28/24 | Price Changed | $1,330 | -5.6% | $2 / Sq Ft |
| 02/27/2024 02/27/24 | Price Changed | $1,409 | +5.5% | $2 / Sq Ft |
| 02/25/2024 02/25/24 | Price Changed | $1,335 | +0.4% | $2 / Sq Ft |
| 02/17/2024 02/17/24 | Price Changed | $1,330 | -1.5% | $2 / Sq Ft |
| 02/15/2024 02/15/24 | Price Changed | $1,350 | -3.5% | $2 / Sq Ft |
| 01/26/2024 01/26/24 | Price Changed | $1,399 | -0.4% | $2 / Sq Ft |
| 01/07/2024 01/07/24 | Price Changed | $1,405 | +0.4% | $2 / Sq Ft |
| 12/28/2023 12/28/23 | Price Changed | $1,399 | +2.9% | $2 / Sq Ft |
| 09/01/2023 09/01/23 | Price Changed | $1,360 | -1.4% | $2 / Sq Ft |
| 08/08/2023 08/08/23 | Price Changed | $1,380 | -4.1% | $2 / Sq Ft |
| 08/08/2023 08/08/23 | For Rent | $1,439 | 0.0% | -- |
| 07/28/2023 07/28/23 | Price Changed | $1,439 | +1.0% | $2 / Sq Ft |
| 07/25/2023 07/25/23 | Price Changed | $1,425 | -1.0% | $2 / Sq Ft |
| 07/23/2023 07/23/23 | Price Changed | $1,439 | +2.9% | $2 / Sq Ft |
| 07/22/2023 07/22/23 | Price Changed | $1,399 | +3.2% | $2 / Sq Ft |
| 07/11/2023 07/11/23 | Price Changed | $1,355 | -3.1% | $2 / Sq Ft |
| 07/09/2023 07/09/23 | Price Changed | $1,399 | +5.2% | $2 / Sq Ft |
| 06/30/2023 06/30/23 | Price Changed | $1,330 | -4.9% | $2 / Sq Ft |
| 06/29/2023 06/29/23 | Price Changed | $1,399 | +0.7% | $2 / Sq Ft |
| 06/24/2023 06/24/23 | Price Changed | $1,389 | +3.7% | $2 / Sq Ft |
| 06/23/2023 06/23/23 | Price Changed | $1,340 | +2.3% | $2 / Sq Ft |
| 06/22/2023 06/22/23 | Price Changed | $1,310 | -2.2% | $2 / Sq Ft |
| 06/22/2023 06/22/23 | Price Changed | $1,340 | +2.3% | $2 / Sq Ft |
| 06/21/2023 06/21/23 | For Rent | $1,310 | 0.0% | -- |
| 05/17/2023 05/17/23 | Price Changed | $1,310 | +1.6% | $2 / Sq Ft |
| 05/10/2023 05/10/23 | Price Changed | $1,289 | -4.4% | $2 / Sq Ft |
| 05/07/2023 05/07/23 | Price Changed | $1,349 | +3.8% | $2 / Sq Ft |
| 05/06/2023 05/06/23 | Price Changed | $1,300 | -3.6% | $2 / Sq Ft |
| 05/03/2023 05/03/23 | Price Changed | $1,349 | +7.1% | $2 / Sq Ft |
| 05/02/2023 05/02/23 | Price Changed | $1,260 | -6.6% | $2 / Sq Ft |
| 04/27/2023 04/27/23 | Price Changed | $1,349 | +7.1% | $2 / Sq Ft |
| 04/12/2023 04/12/23 | Price Changed | $1,260 | -6.5% | $2 / Sq Ft |
| 03/30/2023 03/30/23 | Price Changed | $1,347 | +10.9% | $2 / Sq Ft |
| 03/22/2023 03/22/23 | Price Changed | $1,215 | -3.6% | $2 / Sq Ft |
| 02/07/2023 02/07/23 | Price Changed | $1,260 | -6.5% | $2 / Sq Ft |
| 02/01/2023 02/01/23 | Price Changed | $1,347 | +6.9% | $2 / Sq Ft |
| 01/17/2023 01/17/23 | Price Changed | $1,260 | -6.5% | $2 / Sq Ft |
| 12/20/2022 12/20/22 | Price Changed | $1,347 | -4.9% | $2 / Sq Ft |
| 12/16/2022 12/16/22 | Price Changed | $1,416 | +12.4% | $2 / Sq Ft |
| 12/15/2022 12/15/22 | Price Changed | $1,260 | +0.4% | $2 / Sq Ft |
| 11/03/2022 11/03/22 | Price Changed | $1,255 | +0.4% | $2 / Sq Ft |
| 10/07/2022 10/07/22 | Price Changed | $1,250 | +0.4% | $2 / Sq Ft |
| 10/04/2022 10/04/22 | Price Changed | $1,245 | -1.6% | $2 / Sq Ft |
| 09/28/2022 09/28/22 | Price Changed | $1,265 | -7.7% | $2 / Sq Ft |
| 09/27/2022 09/27/22 | Price Changed | $1,371 | +1.3% | $2 / Sq Ft |
| 09/23/2022 09/23/22 | Price Changed | $1,353 | -1.3% | $2 / Sq Ft |
| 09/21/2022 09/21/22 | Price Changed | $1,371 | +1.3% | $2 / Sq Ft |
| 09/15/2022 09/15/22 | Price Changed | $1,353 | +0.7% | $2 / Sq Ft |
| 09/07/2022 09/07/22 | Price Changed | $1,343 | +7.0% | $2 / Sq Ft |
| 08/30/2022 08/30/22 | Price Changed | $1,255 | -9.8% | $2 / Sq Ft |
| 08/13/2022 08/13/22 | Price Changed | $1,391 | +10.8% | $2 / Sq Ft |
| 08/12/2022 08/12/22 | Price Changed | $1,255 | -9.8% | $2 / Sq Ft |
| 08/07/2022 08/07/22 | Price Changed | $1,391 | +5.1% | $2 / Sq Ft |
| 07/29/2022 07/29/22 | Price Changed | $1,323 | -4.9% | $2 / Sq Ft |
| 07/22/2022 07/22/22 | Price Changed | $1,391 | +1.3% | $2 / Sq Ft |
| 07/21/2022 07/21/22 | Price Changed | $1,373 | -1.3% | $2 / Sq Ft |
| 07/20/2022 07/20/22 | Price Changed | $1,391 | +1.3% | $2 / Sq Ft |
| 07/06/2022 07/06/22 | Price Changed | $1,373 | -1.3% | $2 / Sq Ft |
| 07/03/2022 07/03/22 | Price Changed | $1,391 | +1.3% | $2 / Sq Ft |
| 07/01/2022 07/01/22 | Price Changed | $1,373 | +9.4% | $2 / Sq Ft |
| 06/17/2022 06/17/22 | Price Changed | $1,255 | -7.8% | $2 / Sq Ft |
| 06/11/2022 06/11/22 | Price Changed | $1,361 | +11.6% | $2 / Sq Ft |
| 06/07/2022 06/07/22 | For Rent | $1,220 | 0.0% | -- |
| 05/18/2022 05/18/22 | For Rent | $1,220 | -- | -- |
Tax History Compared to Growth
Tax History
| Year | Tax Paid | Tax Assessment Tax Assessment Total Assessment is a certain percentage of the fair market value that is determined by local assessors to be the total taxable value of land and additions on the property. | Land | Improvement |
|---|---|---|---|---|
| 2023 | $1,119,080 | $48,560,779 | $7,642,968 | $40,917,811 |
| 2022 | $1,044,397 | $40,850,000 | $7,642,968 | $33,207,032 |
| 2021 | $961,989 | $38,529,741 | $6,551,115 | $31,978,626 |
| 2020 | $1,060,258 | $39,582,597 | $6,551,115 | $33,031,482 |
| 2019 | $958,480 | $34,414,689 | $6,551,115 | $27,863,574 |
| 2018 | $1,040,239 | $34,445,000 | $6,551,115 | $27,893,885 |
| 2017 | $959,419 | $34,476,621 | $6,529,200 | $27,947,421 |
| 2016 | $1,104,227 | $39,680,270 | $4,352,800 | $35,327,470 |
| 2015 | $830,755 | $33,106,392 | $3,264,600 | $29,841,792 |
| 2014 | $830,755 | $29,364,844 | $3,264,600 | $26,100,244 |
Source: Public Records
Map
Nearby Homes
- 20607 Alfonso Ct
- 1834 Jara Ct
- 2123 Treasure Mountain Dr
- 20623 Louetta Woods Dr
- 3224 Bright Maple Dr
- 3236 Bright Maple Dr
- 3272 Bright Maple Dr
- 3276 Bright Maple Dr
- 3252 Bright Maple Dr
- 3212 Bright Maple Dr
- 20802 Louetta Oak Dr
- 20614 Nannette Ln
- 000 Louetta Rd
- 2003 Louetta Reserve Way
- 2406 Meadow Tree Ln
- 20311 Budde Cemetary Rd
- 2519 Meadow Tree Ln
- 0 Sagging Oaks Dr
- 2618 Piemonte Avenue Cir
- 2606 Piemonte Avenue Cir