
Seller's Agent in 2022
Donal Minihan
RE/MAX
(775) 870-5209
2 in this area
103 Total Sales
Estimated Value: $317,000
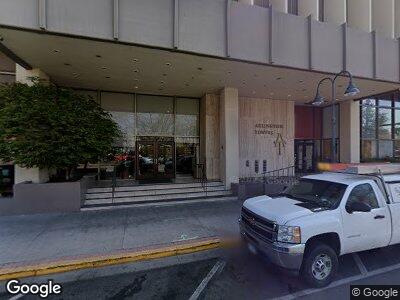
Recently remodeled west facing 1 bed condo at Arlington towers with stunning views of the Sierra Nevada Mountains and the Truckee River. Large greatroom with new appliances, wood floors, ample natural light that opens onto a balcony with amazing views of the city and mountains. A generously sized bedroom with stunning views and private bathroom. The greatroom has a half bath for visitors. Enjoy the downtown location, Truckee river and the HOA amenities including swimming pool, gym, rec room and parking.
| Date | Event | Price | Change | Sq Ft Price |
|---|---|---|---|---|
| 12/08/2022 12/08/22 | Rented | $1,700 | 0.0% | -- |
| 11/23/2022 11/23/22 | For Rent | $1,700 | 0.0% | -- |
| 12/06/2021 12/06/21 | Sold | $440,000 | -2.0% | $385 / Sq Ft |
| 11/16/2021 11/16/21 | Pending | -- | -- | -- |
| 11/12/2021 11/12/21 | For Sale | $449,000 | +26311.8% | $392 / Sq Ft |
| 08/25/2017 08/25/17 | Sold | $1,700 | 0.0% | $1 / Sq Ft |
| 08/08/2017 08/08/17 | Rented | $995 | -9.1% | -- |
| 08/08/2017 08/08/17 | Under Contract | -- | -- | -- |
| 08/01/2017 08/01/17 | Pending | -- | -- | -- |
| 06/30/2017 06/30/17 | Rented | $1,095 | -42.4% | -- |
| 06/19/2017 06/19/17 | Under Contract | -- | -- | -- |
| 06/12/2017 06/12/17 | For Sale | $1,900 | 0.0% | $2 / Sq Ft |
| 06/07/2017 06/07/17 | For Rent | $1,195 | +9.1% | -- |
| 04/07/2017 04/07/17 | For Rent | $1,095 | -21.8% | -- |
| 02/01/2017 02/01/17 | Rented | $1,400 | 0.0% | -- |
| 01/31/2017 01/31/17 | Under Contract | -- | -- | -- |
| 01/22/2017 01/22/17 | For Rent | $1,400 | 0.0% | -- |
| 08/26/2015 08/26/15 | Sold | $82,500 | -2.9% | $176 / Sq Ft |
| 08/03/2015 08/03/15 | Pending | -- | -- | -- |
| 07/13/2015 07/13/15 | For Sale | $85,000 | 0.0% | $182 / Sq Ft |
| 06/09/2015 06/09/15 | Rented | $1,250 | +39.7% | -- |
| 06/09/2015 06/09/15 | Under Contract | -- | -- | -- |
| 05/15/2015 05/15/15 | Rented | $895 | 0.0% | -- |
| 05/15/2015 05/15/15 | Under Contract | -- | -- | -- |
| 04/28/2015 04/28/15 | For Rent | $895 | -33.7% | -- |
| 01/23/2015 01/23/15 | For Rent | $1,350 | +80.0% | -- |
| 11/24/2014 11/24/14 | Rented | $750 | -11.8% | -- |
| 11/24/2014 11/24/14 | Under Contract | -- | -- | -- |
| 09/02/2014 09/02/14 | For Rent | $850 | +6.9% | -- |
| 01/17/2014 01/17/14 | Rented | $795 | -27.4% | -- |
| 01/17/2014 01/17/14 | Under Contract | -- | -- | -- |
| 11/29/2013 11/29/13 | Rented | $1,095 | +28.8% | -- |
| 11/25/2013 11/25/13 | Under Contract | -- | -- | -- |
| 07/26/2013 07/26/13 | For Rent | $850 | -28.9% | -- |
| 05/04/2013 05/04/13 | For Rent | $1,195 | -4.4% | -- |
| 02/28/2013 02/28/13 | Rented | $1,250 | -30.6% | -- |
| 02/28/2013 02/28/13 | Under Contract | -- | -- | -- |
| 02/01/2013 02/01/13 | Rented | $1,800 | +44.0% | -- |
| 02/01/2013 02/01/13 | Under Contract | -- | -- | -- |
| 12/02/2012 12/02/12 | For Rent | $1,250 | -30.6% | -- |
| 11/13/2012 11/13/12 | For Rent | $1,800 | 0.0% | -- |
| 07/20/2012 07/20/12 | Sold | $70,000 | +7.7% | $112 / Sq Ft |
| 06/19/2012 06/19/12 | Pending | -- | -- | -- |
| 06/15/2012 06/15/12 | For Sale | $65,000 | +16.1% | $104 / Sq Ft |
| 04/06/2012 04/06/12 | Sold | $56,000 | 0.0% | $93 / Sq Ft |
| 03/10/2012 03/10/12 | Rented | $1,250 | -97.9% | -- |
| 03/10/2012 03/10/12 | Under Contract | -- | -- | -- |
| 02/08/2012 02/08/12 | Pending | -- | -- | -- |
| 01/28/2012 01/28/12 | For Sale | $59,000 | 0.0% | $98 / Sq Ft |
| 01/06/2012 01/06/12 | For Rent | $1,250 | -- | -- |
| Year | Tax Paid | Tax Assessment Tax Assessment Total Assessment is a certain percentage of the fair market value that is determined by local assessors to be the total taxable value of land and additions on the property. | Land | Improvement |
|---|---|---|---|---|
| 2025 | -- | -- | -- | -- |
| 2024 | -- | -- | -- | -- |
| 2023 | $0 | $0 | $0 | $0 |
| 2022 | $0 | $0 | $0 | $0 |
| 2021 | $0 | $0 | $0 | $0 |
| 2020 | $0 | $0 | $0 | $0 |
| 2019 | $0 | $0 | $0 | $0 |
| 2018 | $0 | $0 | $0 | $0 |
| 2017 | -- | $0 | $0 | $0 |
| 2016 | -- | $0 | $0 | $0 |
Seller's Agent in 2022
Donal Minihan
RE/MAX
(775) 870-5209
2 in this area
103 Total Sales
N
Buyer's Agent in 2022
Non MLS Agent
Non MLS Office
M
Seller's Agent in 2021
Member Non
Non Member Office
Buyer's Agent in 2021
Jana Nelson
Compass
(530) 318-7610
4 in this area
96 Total Sales
Seller's Agent in 2017
Kevin Sigstad
RE/MAX
(775) 284-1808
Seller's Agent in 2017
Jeanene Raffanelli
RE/MAX
(775) 771-0240
62 Total Sales