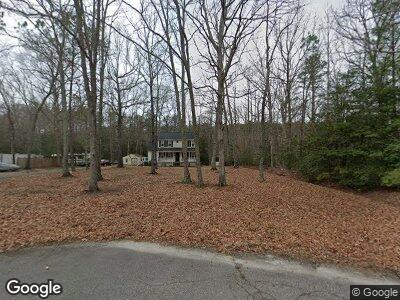
10940 Long Branch Dr Chesterfield, VA 23832
Estimated Value: $351,000 - $406,000
3
Beds
3
Baths
1,650
Sq Ft
$223/Sq Ft
Est. Value
About This Home
This home is located at 10940 Long Branch Dr, Chesterfield, VA 23832 and is currently estimated at $367,789, approximately $222 per square foot. 10940 Long Branch Dr is a home located in Chesterfield County with nearby schools including Spring Run Elementary School, Bailey Bridge Middle School, and Manchester High.
Ownership History
Date
Name
Owned For
Owner Type
Purchase Details
Closed on
Apr 6, 2017
Sold by
Mcallister Johnny F and Mcallister Patricia E
Bought by
Spain Lori
Current Estimated Value
Home Financials for this Owner
Home Financials are based on the most recent Mortgage that was taken out on this home.
Original Mortgage
$194,732
Outstanding Balance
$164,625
Interest Rate
4.37%
Mortgage Type
FHA
Estimated Equity
$203,164
Purchase Details
Closed on
Apr 22, 2002
Bought by
Mcallister Johnny F and Mcallister Patridia E
Home Financials for this Owner
Home Financials are based on the most recent Mortgage that was taken out on this home.
Original Mortgage
$15,500
Interest Rate
6.85%
Mortgage Type
New Conventional
Purchase Details
Closed on
Jan 28, 2002
Bought by
Mcallister Johnny F and Mcallister Patricia E
Home Financials for this Owner
Home Financials are based on the most recent Mortgage that was taken out on this home.
Original Mortgage
$100,000
Interest Rate
7.08%
Mortgage Type
New Conventional
Create a Home Valuation Report for This Property
The Home Valuation Report is an in-depth analysis detailing your home's value as well as a comparison with similar homes in the area
Home Values in the Area
Average Home Value in this Area
Purchase History
| Date | Buyer | Sale Price | Title Company |
|---|---|---|---|
| Spain Lori | $198,325 | Attorney | |
| Mcallister Johnny F | -- | -- | |
| Mcallister Johnny F | -- | -- |
Source: Public Records
Mortgage History
| Date | Status | Borrower | Loan Amount |
|---|---|---|---|
| Open | Spain Lori | $194,732 | |
| Previous Owner | Mcallister Johnny F | $125,000 | |
| Previous Owner | Mcallister Johnny F | $15,500 | |
| Previous Owner | Mcallister Johnny F | $100,000 |
Source: Public Records
Tax History Compared to Growth
Tax History
| Year | Tax Paid | Tax Assessment Tax Assessment Total Assessment is a certain percentage of the fair market value that is determined by local assessors to be the total taxable value of land and additions on the property. | Land | Improvement |
|---|---|---|---|---|
| 2024 | $2,484 | $273,200 | $70,000 | $203,200 |
| 2023 | $2,359 | $259,200 | $70,000 | $189,200 |
| 2022 | $2,202 | $239,400 | $57,000 | $182,400 |
| 2021 | $2,123 | $220,800 | $55,000 | $165,800 |
| 2020 | $2,005 | $211,100 | $53,000 | $158,100 |
| 2019 | $1,947 | $204,900 | $51,000 | $153,900 |
| 2018 | $1,831 | $192,700 | $49,000 | $143,700 |
| 2017 | $1,778 | $185,200 | $48,000 | $137,200 |
| 2016 | $1,651 | $172,000 | $48,000 | $124,000 |
| 2015 | $1,625 | $169,300 | $48,000 | $121,300 |
| 2014 | $1,581 | $164,700 | $48,000 | $116,700 |
Source: Public Records
Map
Nearby Homes
- 12007 Chesmount Dr
- 9909 Qualla Rd
- 13319 Beachcrest Dr
- 10537 Beachcrest Ct
- 9741 Bending Oak Dr
- 10111 Clearwood Rd
- 13513 Pinstone Ct
- 9942 Greywell Terrace
- 12120 Bundle Rd
- 9400 Kinnerton Dr
- 9918 Fawnhope Ct
- 14518 Shipborne Rd
- 14342 Hockliffe Ln
- 9636 Brading Ln
- 12025 Eagle Pass Dr
- 7825 Secretariat Dr
- 10013 Brading Ln
- 9200 Lady Anne Ln
- 10006 Brading Ln
- 13700 Orchid Dr