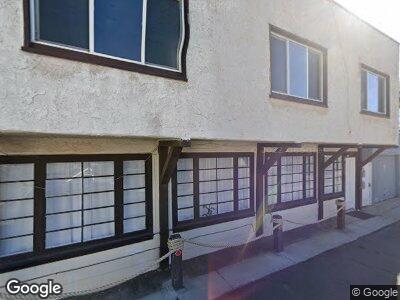
1132 Hingham Ln Ventura, CA 93001
Pierpont NeighborhoodEstimated Value: $925,495 - $1,554,000
--
Bed
--
Bath
1,541
Sq Ft
$881/Sq Ft
Est. Value
About This Home
This home is located at 1132 Hingham Ln, Ventura, CA 93001 and is currently estimated at $1,356,874, approximately $880 per square foot. 1132 Hingham Ln is a home located in Ventura County with nearby schools including Pierpont Elementary School, Cabrillo Middle School, and Ventura High School.
Ownership History
Date
Name
Owned For
Owner Type
Purchase Details
Closed on
Aug 23, 2022
Sold by
Walter Esop Verner and Walter Elizabeth Jean
Bought by
Esop Family 2022 Trust
Current Estimated Value
Purchase Details
Closed on
Jul 21, 2021
Sold by
Esop Verner W and Esop Jean Elizabeth
Bought by
Esop Verner W and Esop Jean Elizabeth
Purchase Details
Closed on
Oct 2, 2013
Sold by
Esop Verner W
Bought by
Esop Verner W and Esop Jean Elizabeth
Purchase Details
Closed on
Nov 23, 2012
Sold by
Esop Verner W and Esop Jean Elizabeth
Bought by
Esop Verner W
Home Financials for this Owner
Home Financials are based on the most recent Mortgage that was taken out on this home.
Original Mortgage
$275,000
Interest Rate
3.36%
Mortgage Type
New Conventional
Purchase Details
Closed on
Jun 26, 1996
Sold by
Smith M Brent and Smith Dolores M
Bought by
Esop Verner W
Home Financials for this Owner
Home Financials are based on the most recent Mortgage that was taken out on this home.
Original Mortgage
$182,616
Interest Rate
8.09%
Mortgage Type
FHA
Create a Home Valuation Report for This Property
The Home Valuation Report is an in-depth analysis detailing your home's value as well as a comparison with similar homes in the area
Home Values in the Area
Average Home Value in this Area
Purchase History
| Date | Buyer | Sale Price | Title Company |
|---|---|---|---|
| Esop Family 2022 Trust | -- | -- | |
| Esop Verner W | -- | None Available | |
| Esop Verner W | -- | None Available | |
| Esop Verner W | -- | Orange Coast Title Company | |
| Esop Verner W | $190,000 | First American Title Ins |
Source: Public Records
Mortgage History
| Date | Status | Borrower | Loan Amount |
|---|---|---|---|
| Previous Owner | Esop Verner W | $275,000 | |
| Previous Owner | Esop Verner W | $130,000 | |
| Previous Owner | Esop Verner W | $72,000 | |
| Previous Owner | Esop Verner W | $182,000 | |
| Previous Owner | Esop Verner W | $182,616 |
Source: Public Records
Tax History Compared to Growth
Tax History
| Year | Tax Paid | Tax Assessment Tax Assessment Total Assessment is a certain percentage of the fair market value that is determined by local assessors to be the total taxable value of land and additions on the property. | Land | Improvement |
|---|---|---|---|---|
| 2024 | $3,469 | $309,418 | $162,854 | $146,564 |
| 2023 | $3,428 | $303,351 | $159,660 | $143,691 |
| 2022 | $3,195 | $297,403 | $156,529 | $140,874 |
| 2021 | $3,135 | $291,572 | $153,460 | $138,112 |
| 2020 | $3,105 | $288,585 | $151,888 | $136,697 |
| 2019 | $3,049 | $282,927 | $148,910 | $134,017 |
| 2018 | $2,999 | $277,381 | $145,991 | $131,390 |
| 2017 | $2,937 | $271,943 | $143,129 | $128,814 |
| 2016 | $2,880 | $266,612 | $140,323 | $126,289 |
| 2015 | $2,850 | $262,609 | $138,216 | $124,393 |
| 2014 | $2,804 | $257,466 | $135,509 | $121,957 |
Source: Public Records
Map
Nearby Homes
- 1120 Pittsfield Ln
- 1100 Shelburn Ln
- 1129 Dover Ln
- 1029 Dover Ln
- 1216 Kingston Ln
- 0 Monmouth Dr
- 1173 Norwich Ln
- 1177 Norwich Ln
- 1199 New Bedford Ct
- 1023 Brockton Ln
- 1081 Brockton Ln
- 2515 Harbor Blvd Unit 1
- 2523 Harbor Blvd Unit 3
- 0 Alessandro Dr Unit V1-27834
- 1260 Sagamore Ln
- 1322 Weymouth Ln
- 2726 Sailor Ave
- 2784 Bayshore Ave
- 2392 Haley Point Dr Unit 103
- 2392 Haley Point Dr