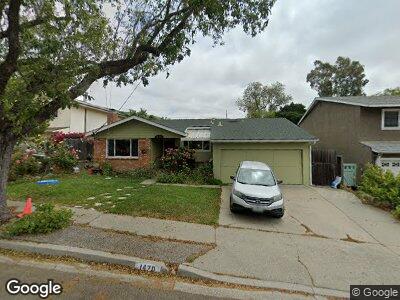
1470 Tanglewood Ct Unit 1 San Luis Obispo, CA 93401
Arlita NeighborhoodEstimated Value: $976,534 - $1,181,000
4
Beds
2
Baths
1,657
Sq Ft
$655/Sq Ft
Est. Value
About This Home
This home is located at 1470 Tanglewood Ct Unit 1, San Luis Obispo, CA 93401 and is currently estimated at $1,085,134, approximately $654 per square foot. 1470 Tanglewood Ct Unit 1 is a home located in San Luis Obispo County with nearby schools including Sinsheimer Elementary School, Laguna Middle School, and San Luis Obispo High School.
Ownership History
Date
Name
Owned For
Owner Type
Purchase Details
Closed on
Sep 2, 2024
Sold by
Canaan Mark A and Canaan Rozella P
Bought by
Canaan Family Revocable Trust and Canaan
Current Estimated Value
Purchase Details
Closed on
Oct 6, 1994
Sold by
Mees Thomas C and Mees Patricia K
Bought by
Canaan Mark A and Canaan Rozella P
Home Financials for this Owner
Home Financials are based on the most recent Mortgage that was taken out on this home.
Original Mortgage
$185,600
Interest Rate
8.5%
Create a Home Valuation Report for This Property
The Home Valuation Report is an in-depth analysis detailing your home's value as well as a comparison with similar homes in the area
Home Values in the Area
Average Home Value in this Area
Purchase History
| Date | Buyer | Sale Price | Title Company |
|---|---|---|---|
| Canaan Family Revocable Trust | -- | None Listed On Document | |
| Canaan Mark A | $232,000 | Cuesta Title Guaranty Co |
Source: Public Records
Mortgage History
| Date | Status | Borrower | Loan Amount |
|---|---|---|---|
| Previous Owner | Canaan Mark A | $196,000 | |
| Previous Owner | Canaan Mark A | $200,000 | |
| Previous Owner | Canaan Mark A | $152,298 | |
| Previous Owner | Canaan Mark A | $358,500 | |
| Previous Owner | Canaan Mark A | $360,000 | |
| Previous Owner | Canaan Mark A | $339,000 | |
| Previous Owner | Canaan Mark A | $80,300 | |
| Previous Owner | Canaan Mark A | $150,000 | |
| Previous Owner | Canaan Mark A | $273,000 | |
| Previous Owner | Canaan Mark A | $239,000 | |
| Previous Owner | Canaan Mark A | $125,000 | |
| Previous Owner | Canaan Mark A | $215,000 | |
| Previous Owner | Canaan Mark A | $185,600 |
Source: Public Records
Tax History Compared to Growth
Tax History
| Year | Tax Paid | Tax Assessment Tax Assessment Total Assessment is a certain percentage of the fair market value that is determined by local assessors to be the total taxable value of land and additions on the property. | Land | Improvement |
|---|---|---|---|---|
| 2024 | $4,068 | $382,007 | $214,057 | $167,950 |
| 2023 | $4,068 | $374,517 | $209,860 | $164,657 |
| 2022 | $3,812 | $367,175 | $205,746 | $161,429 |
| 2021 | $3,749 | $359,976 | $201,712 | $158,264 |
| 2020 | $3,710 | $356,286 | $199,644 | $156,642 |
| 2019 | $3,670 | $349,301 | $195,730 | $153,571 |
| 2018 | $3,597 | $342,453 | $191,893 | $150,560 |
| 2017 | $3,525 | $335,739 | $188,131 | $147,608 |
| 2016 | $3,454 | $329,157 | $184,443 | $144,714 |
| 2015 | $3,401 | $324,214 | $181,673 | $142,541 |
| 2014 | $3,121 | $317,864 | $178,115 | $139,749 |
Source: Public Records
Map
Nearby Homes
- 1577 Tanglewood Dr
- 1330 Southwood Dr Unit 18
- 1255 Orcutt Rd Unit A14
- 1255 Orcutt Rd Unit B45
- 1360 Laurel Ln Unit 2
- 3156 Johnson Ave
- 1121 Orcutt Rd Unit 15
- 1121 Orcutt Rd Unit 28
- 3802 Ranch House Rd Unit 101
- 1170 Lexington Ct
- 1041 Southwood Dr Unit H
- 1031 Southwood Dr Unit B
- 1037 Southwood Dr Unit D
- 1043 Southwood Dr Unit F
- 1017 Southwood Dr Unit B
- 1023 Southwood Dr Unit B
- 2855 Johnson Ave
- 962 Tarragon Ln Unit 1502
- 1609 Calle Crotalo
- 2797 Flora St