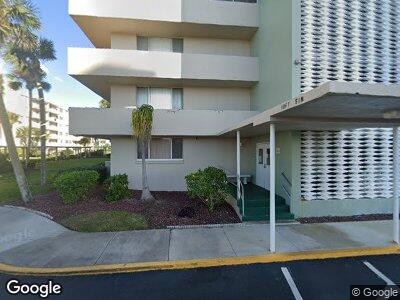
Twin Towers 2020 N Atlantic Ave Unit 110-S Cocoa Beach, FL 32931
Cocoa Beach NeighborhoodEstimated Value: $246,445 - $274,000
2
Beds
2
Baths
816
Sq Ft
$319/Sq Ft
Est. Value
About This Home
This home is located at 2020 N Atlantic Ave Unit 110-S, Cocoa Beach, FL 32931 and is currently estimated at $260,361, approximately $319 per square foot. 2020 N Atlantic Ave Unit 110-S is a home located in Brevard County with nearby schools including Cape View Elementary School, Cocoa Beach Junior/Senior High School, and Our Saviour School.
Ownership History
Date
Name
Owned For
Owner Type
Purchase Details
Closed on
Jun 16, 2017
Sold by
Charles Schwab Bank
Bought by
Gillispie Christopher
Current Estimated Value
Home Financials for this Owner
Home Financials are based on the most recent Mortgage that was taken out on this home.
Original Mortgage
$148,000
Outstanding Balance
$125,670
Interest Rate
3.91%
Estimated Equity
$143,101
Purchase Details
Closed on
May 21, 2010
Sold by
Zahaykevich Luba
Bought by
Lewis Precetha C and Lewis Jerra
Home Financials for this Owner
Home Financials are based on the most recent Mortgage that was taken out on this home.
Original Mortgage
$67,200
Interest Rate
5.15%
Purchase Details
Closed on
May 9, 2003
Sold by
Barry Joyce M and Strohecker Kathy M
Bought by
Zahaykevich Bohdan and Zahaykevich Luba
Home Financials for this Owner
Home Financials are based on the most recent Mortgage that was taken out on this home.
Original Mortgage
$108,800
Interest Rate
5.76%
Mortgage Type
Purchase Money Mortgage
Create a Home Valuation Report for This Property
The Home Valuation Report is an in-depth analysis detailing your home's value as well as a comparison with similar homes in the area
Home Values in the Area
Average Home Value in this Area
Purchase History
| Date | Buyer | Sale Price | Title Company |
|---|---|---|---|
| Gillispie Christopher | $10 | -- | |
| Lewis Precetha C | $96,000 | Landmark Title Agency Inc | |
| Zahaykevich Bohdan | $150,000 | -- |
Source: Public Records
Mortgage History
| Date | Status | Borrower | Loan Amount |
|---|---|---|---|
| Open | Gillispie Christopher | $148,000 | |
| Closed | Gillispie Christopher | -- | |
| Previous Owner | Lewis Precetha C | $67,200 | |
| Previous Owner | Zahaykevich Bohdan | $108,800 |
Source: Public Records
Tax History Compared to Growth
Tax History
| Year | Tax Paid | Tax Assessment Tax Assessment Total Assessment is a certain percentage of the fair market value that is determined by local assessors to be the total taxable value of land and additions on the property. | Land | Improvement |
|---|---|---|---|---|
| 2023 | $3,020 | $211,380 | $0 | $211,380 |
| 2022 | $2,743 | $214,330 | $0 | $0 |
| 2021 | $2,232 | $134,280 | $0 | $134,280 |
| 2020 | $2,250 | $134,280 | $0 | $134,280 |
| 2019 | $2,091 | $122,070 | $0 | $122,070 |
| 2018 | $1,981 | $113,530 | $0 | $113,530 |
| 2017 | $1,945 | $113,110 | $0 | $113,110 |
| 2016 | $1,915 | $118,110 | $0 | $0 |
| 2015 | $1,656 | $86,820 | $0 | $0 |
| 2014 | $1,489 | $78,930 | $0 | $0 |
Source: Public Records
About Twin Towers
Map
Nearby Homes
- 2020 N Atlantic Ave Unit 204-S
- 2020 N Atlantic Ave Unit 406-N
- 2020 N Atlantic Ave Unit 214-S
- 1890 N Atlantic Ave Unit A403
- 1890 N Atlantic Ave Unit A406
- 2090 N Atlantic Ave Unit 402
- 2100 N Atlantic Ave Unit 1104
- 2100 N Atlantic Ave Unit P3
- 2100 N Atlantic Ave Unit 308
- 2100 N Atlantic Ave Unit 206
- 2100 N Atlantic Ave Unit 108
- 2100 N Atlantic Ave Unit 302
- 1830 N Atlantic Ave Unit C503
- 1830 N Atlantic Ave Unit C101
- 1860 N Atlantic Ave Unit B204
- 1860 N Atlantic Ave Unit B806
- 1860 N Atlantic Ave Unit B604
- 1860 N Atlantic Ave Unit B504
- 1700 N Atlantic Ave Unit 151 5th Floor
- 1700 N Atlantic Ave Unit 156