P
Seller's Agent in 2025
Panagiotis Kalabokis
MTM Real Estate Corp.
5 in this area
43 Total Sales
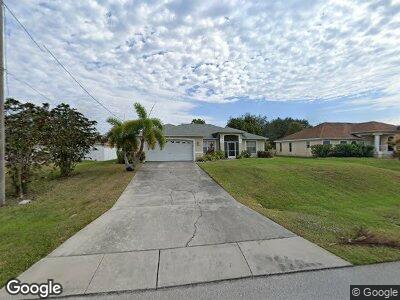
NEWLY UPDATED 3/2 WITH A POOL IN SW CAPE. NEW TILE THROUGHOUT AND NEW MODERN INTERIOR PAINT. Comfortable split bedroom plan with sliders to the lanai. STAINLESS APPLIANCES in kitchen with breakfast bar and breakfast nook. Sliders to lanai and screened pool. Convenient mid-Cape location near bridges, restaurants, shopping and schools. City water and sewer. Pets accepted with owner approval and non-refundable pet fee. Available NOW!
| Date | Buyer | Sale Price | Title Company |
|---|---|---|---|
| Blue Moon Holdings Llc | $128,700 | Best Title Solutions Inc | |
| Manning Maritza | $5,000 | -- |
| Date | Status | Borrower | Loan Amount |
|---|---|---|---|
| Closed | Blue Moon Holdings Llc | $1,000,000 | |
| Previous Owner | Manning Michael | $15,000 | |
| Previous Owner | Manning Michael | $238,000 | |
| Previous Owner | Manning Michael | $215,000 | |
| Previous Owner | Manning Michael | $144,000 | |
| Previous Owner | Manning Michael | $25,000 | |
| Previous Owner | Manning Maritza | $130,500 | |
| Previous Owner | Manning Maritza | $109,000 |
| Date | Event | Price | Change | Sq Ft Price |
|---|---|---|---|---|
| 02/15/2025 02/15/25 | Rented | -- | -- | -- |
| 01/23/2025 01/23/25 | For Rent | $2,500 | -7.4% | -- |
| 06/15/2024 06/15/24 | Rented | -- | -- | -- |
| 05/24/2024 05/24/24 | Price Changed | $2,700 | -6.9% | $2 / Sq Ft |
| 04/23/2024 04/23/24 | For Rent | $2,900 | 0.0% | -- |
| 03/01/2023 03/01/23 | Rented | -- | -- | -- |
| 02/01/2023 02/01/23 | For Rent | $2,900 | +132.0% | -- |
| 02/09/2022 02/09/22 | For Rent | -- | -- | -- |
| 02/09/2022 02/09/22 | Rented | -- | -- | -- |
| 02/20/2019 02/20/19 | For Rent | -- | -- | -- |
| 02/20/2019 02/20/19 | Rented | -- | -- | -- |
| 09/27/2012 09/27/12 | Rented | $1,250 | 0.0% | -- |
| 08/28/2012 08/28/12 | Under Contract | -- | -- | -- |
| 08/15/2012 08/15/12 | For Rent | $1,250 | -- | -- |
| Year | Tax Paid | Tax Assessment Tax Assessment Total Assessment is a certain percentage of the fair market value that is determined by local assessors to be the total taxable value of land and additions on the property. | Land | Improvement |
|---|---|---|---|---|
| 2024 | $6,350 | $296,728 | -- | -- |
| 2023 | $6,350 | $269,753 | $0 | $0 |
| 2022 | $5,804 | $245,230 | $0 | $0 |
| 2021 | $5,421 | $223,267 | $28,000 | $195,267 |
| 2020 | $5,141 | $202,669 | $28,000 | $174,669 |
| 2019 | $4,960 | $198,642 | $25,500 | $173,142 |
| 2018 | $4,762 | $188,145 | $22,000 | $166,145 |
| 2017 | $4,555 | $177,647 | $12,000 | $165,647 |
| 2016 | $4,380 | $164,622 | $12,000 | $152,622 |
| 2015 | $4,164 | $149,484 | $9,500 | $139,984 |
| 2014 | $3,912 | $133,196 | $6,580 | $126,616 |
| 2013 | -- | $121,300 | $4,800 | $116,500 |
P
Seller's Agent in 2025
Panagiotis Kalabokis
MTM Real Estate Corp.
5 in this area
43 Total Sales

Buyer's Agent in 2024
Kelley Ramage
RE/MAX
(239) 209-3770
6 Total Sales
T
Buyer's Agent in 2022
Tammye Cates
Royal Shell Real Estate, Inc.
(630) 240-6979
L
Buyer's Agent in 2012
Lisa Farmer
Maxim LLC