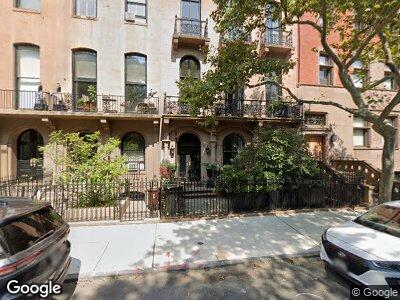
243 E 17th St New York, NY 10003
Gramercy Park NeighborhoodEstimated Value: $3,341,000 - $12,442,168
6
Beds
7
Baths
8,500
Sq Ft
$900/Sq Ft
Est. Value
About This Home
This home is located at 243 E 17th St, New York, NY 10003 and is currently estimated at $7,651,056, approximately $900 per square foot. 243 E 17th St is a home located in New York County with nearby schools including P.S. 40 Augustus Saint-Gaudens, Simon Baruch Middle School 104, and Clinton School.
Ownership History
Date
Name
Owned For
Owner Type
Purchase Details
Closed on
Jun 15, 2017
Sold by
Beck Petterson Noelle and Beck Noelle
Bought by
Iona On The Park Llc
Current Estimated Value
Home Financials for this Owner
Home Financials are based on the most recent Mortgage that was taken out on this home.
Original Mortgage
$5,777,142
Outstanding Balance
$4,896,397
Interest Rate
4.02%
Mortgage Type
Purchase Money Mortgage
Estimated Equity
$3,136,341
Purchase Details
Closed on
Aug 7, 1997
Sold by
John Schonfeld Amanda and John Dorothea D
Bought by
Petterson Eric and Petterson Noelle Beck
Home Financials for this Owner
Home Financials are based on the most recent Mortgage that was taken out on this home.
Original Mortgage
$1,100,000
Interest Rate
7.25%
Create a Home Valuation Report for This Property
The Home Valuation Report is an in-depth analysis detailing your home's value as well as a comparison with similar homes in the area
Home Values in the Area
Average Home Value in this Area
Purchase History
| Date | Buyer | Sale Price | Title Company |
|---|---|---|---|
| Iona On The Park Llc | $13,500,000 | -- | |
| Petterson Eric | $1,595,000 | -- |
Source: Public Records
Mortgage History
| Date | Status | Borrower | Loan Amount |
|---|---|---|---|
| Open | Iona On The Park Llc | $1,225,000 | |
| Open | Iona On The Park Llc | $5,777,142 | |
| Closed | Iona On The Park Llc | $5,777,142 | |
| Previous Owner | Beck-Petterson Noelle | $1,900,000 | |
| Previous Owner | Petterson Eric | $1,100,000 |
Source: Public Records
Tax History Compared to Growth
Tax History
| Year | Tax Paid | Tax Assessment Tax Assessment Total Assessment is a certain percentage of the fair market value that is determined by local assessors to be the total taxable value of land and additions on the property. | Land | Improvement |
|---|---|---|---|---|
| 2024 | $101,807 | $506,880 | $270,000 | $224,116 |
| 2023 | $107,809 | $530,842 | $245,407 | $285,435 |
| 2022 | $105,178 | $619,440 | $270,000 | $349,440 |
| 2021 | $104,602 | $665,640 | $270,000 | $395,640 |
| 2020 | $99,254 | $758,100 | $270,000 | $488,100 |
| 2019 | $92,539 | $719,460 | $270,000 | $449,460 |
| 2018 | $90,177 | $442,368 | $146,253 | $296,115 |
| 2017 | $89,501 | $439,053 | $155,828 | $283,225 |
| 2016 | $82,803 | $414,202 | $158,267 | $255,935 |
| 2015 | $33,304 | $390,758 | $205,036 | $185,722 |
| 2014 | $33,304 | $368,640 | $188,988 | $179,652 |
Source: Public Records
Map
Nearby Homes
- 305 2nd Ave Unit 530
- 305 2nd Ave Unit 501
- 305 2nd Ave Unit 542
- 305 2nd Ave Unit 721
- 305 2nd Ave Unit 516
- 305 2nd Ave Unit 304
- 224 E 17th St Unit 1F
- 224 E 17th St Unit 2F
- 215 E 17th St Unit 2
- 215 E 17th St Unit 3
- 211 E 18th St Unit 3E
- 210 E 18th St
- 210 E 17th St Unit 4B
- 210 E 17th St Unit 6A
- 242 E 19th St Unit 15H
- 242 E 19th St Unit 15 C
- 242 E 19th St Unit 11E
- 242 E 19th St Unit 10-C
- 225 E 19th St Unit PHB
- 225 E 19th St Unit 503