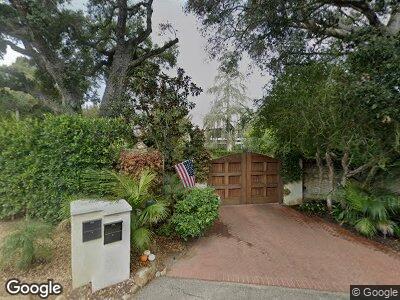
2501 Sycamore Canyon Rd Santa Barbara, CA 93108
Estimated Value: $4,739,000 - $10,938,493
5
Beds
8
Baths
12,690
Sq Ft
$537/Sq Ft
Est. Value
About This Home
This home is located at 2501 Sycamore Canyon Rd, Santa Barbara, CA 93108 and is currently estimated at $6,814,623, approximately $537 per square foot. 2501 Sycamore Canyon Rd is a home located in Santa Barbara County with nearby schools including Cold Spring Elementary School, Santa Barbara Junior High School, and Santa Barbara Senior High School.
Ownership History
Date
Name
Owned For
Owner Type
Purchase Details
Closed on
Jan 28, 2011
Sold by
Montesano Gene and Montesano Arlene
Bought by
Montesano Gene
Current Estimated Value
Purchase Details
Closed on
Sep 27, 1993
Sold by
Weltz Gloria R
Bought by
Montesano Gene and Montesano Arlene
Home Financials for this Owner
Home Financials are based on the most recent Mortgage that was taken out on this home.
Original Mortgage
$999,950
Interest Rate
6.98%
Create a Home Valuation Report for This Property
The Home Valuation Report is an in-depth analysis detailing your home's value as well as a comparison with similar homes in the area
Home Values in the Area
Average Home Value in this Area
Purchase History
| Date | Buyer | Sale Price | Title Company |
|---|---|---|---|
| Montesano Gene | -- | None Available | |
| Montesano Gene | -- | First American Title |
Source: Public Records
Mortgage History
| Date | Status | Borrower | Loan Amount |
|---|---|---|---|
| Closed | Montesano Gene | $999,950 |
Source: Public Records
Tax History Compared to Growth
Tax History
| Year | Tax Paid | Tax Assessment Tax Assessment Total Assessment is a certain percentage of the fair market value that is determined by local assessors to be the total taxable value of land and additions on the property. | Land | Improvement |
|---|---|---|---|---|
| 2023 | $51,099 | $4,641,621 | $1,061,898 | $3,579,723 |
| 2022 | $49,463 | $4,550,610 | $1,041,077 | $3,509,533 |
| 2021 | $48,445 | $4,461,383 | $1,020,664 | $3,440,719 |
| 2020 | $47,626 | $4,415,638 | $1,010,199 | $3,405,439 |
| 2019 | $46,680 | $4,329,058 | $990,392 | $3,338,666 |
| 2018 | $45,793 | $4,244,175 | $970,973 | $3,273,202 |
| 2017 | $44,943 | $4,160,957 | $951,935 | $3,209,022 |
| 2016 | $43,587 | $4,079,370 | $933,270 | $3,146,100 |
| 2014 | $42,241 | $3,939,387 | $901,246 | $3,038,141 |
Source: Public Records