
Seller's Agent in 2025
Alex Hachem
Prestige Realty Brokers Inc
(313) 747-0500
2 in this area
20 Total Sales
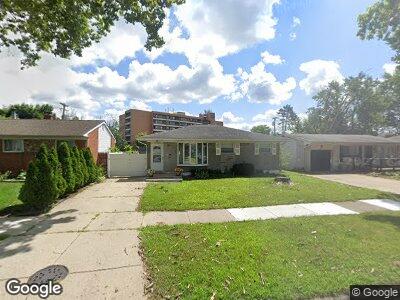
Remarks: WELCOME HOME TO THIS COMPLETELY UPDATED 3 BEDROOM HOME WITH BEAUTIFUL HARDWOOD FLOORING. THE LIVING ROOM IS SPACIOUS WITH A BAY FRONT WINDOW. THE KITCHEN IS COMPLETELY UPDATED WITH APPLS INCLUDED AND ACCESS TO THE COVERED DECK. THE FULL BATH WITH ITS UNIQUE MARBLE AND WALK- IN SHOWER WILL DEFINITELY CATCH YOUR EYES. THE BASEMENT IS FINISHED WITH GLASS BLOCK WINDOWS AND LOTS OF STORAGE. ENJOY YOUR ENTERTAINER'S REAR YARD! YOU'LL APPRECIATE THE NEWER WINDOWS/DOORWALL SLIDING DOOR AND A NEWER CONCRETE DRIVEWA
| Date | Buyer | Sale Price | Title Company |
|---|---|---|---|
| Omar Ali | $110,000 | None Listed On Document | |
| Eason Demetra | $12,000 | Parks Title Company | |
| Abn Amro Mortgage Group Inc | $12,000 | None Available | |
| Drake Alberto E | $99,500 | -- |
| Date | Event | Price | Change | Sq Ft Price |
|---|---|---|---|---|
| 01/30/2025 01/30/25 | Rented | $1,600 | 0.0% | -- |
| 01/28/2025 01/28/25 | Under Contract | -- | -- | -- |
| 12/31/2024 12/31/24 | For Rent | $1,600 | +28.0% | -- |
| 09/28/2022 09/28/22 | Rented | $1,250 | -3.8% | -- |
| 09/28/2022 09/28/22 | Under Contract | -- | -- | -- |
| 09/26/2022 09/26/22 | For Rent | $1,300 | 0.0% | -- |
| 06/29/2022 06/29/22 | Off Market | $1,300 | -- | -- |
| 06/25/2022 06/25/22 | For Rent | $1,300 | 0.0% | -- |
| 06/21/2022 06/21/22 | Sold | $110,000 | -8.3% | $107 / Sq Ft |
| 05/23/2022 05/23/22 | For Sale | $120,000 | -- | $117 / Sq Ft |
| Year | Tax Paid | Tax Assessment Tax Assessment Total Assessment is a certain percentage of the fair market value that is determined by local assessors to be the total taxable value of land and additions on the property. | Land | Improvement |
|---|---|---|---|---|
| 2024 | $2,663 | $45,700 | $0 | $0 |
| 2023 | $2,629 | $36,800 | $0 | $0 |
| 2022 | $1,935 | $30,100 | $0 | $0 |
| 2021 | $2,967 | $27,200 | $0 | $0 |
| 2020 | $2,155 | $23,400 | $0 | $0 |
| 2019 | $3,181 | $19,900 | $0 | $0 |
| 2018 | $1,361 | $17,900 | $0 | $0 |
| 2017 | $822 | $17,700 | $0 | $0 |
| 2016 | $1,993 | $17,900 | $0 | $0 |
| 2015 | $2,200 | $22,000 | $0 | $0 |
| 2013 | $2,980 | $29,800 | $0 | $0 |
| 2012 | $1,800 | $32,800 | $3,000 | $29,800 |
Seller's Agent in 2025
Alex Hachem
Prestige Realty Brokers Inc
(313) 747-0500
2 in this area
20 Total Sales
A
Buyer's Agent in 2025
Agboola Olojo
Ideal Realty and Management LLC
(313) 377-7525
Seller's Agent in 2022
Tanji Grant
Keller Williams Advantage
(248) 345-3434
9 in this area
68 Total Sales