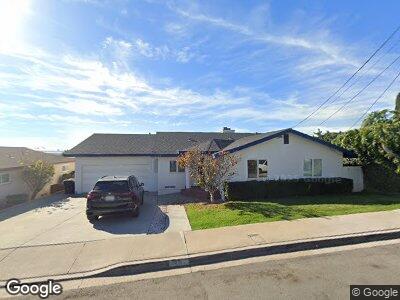
3024 Mcgraw St San Diego, CA 92117
Bay Park NeighborhoodEstimated Value: $1,694,000 - $1,953,000
3
Beds
2
Baths
2,114
Sq Ft
$834/Sq Ft
Est. Value
About This Home
This home is located at 3024 Mcgraw St, San Diego, CA 92117 and is currently estimated at $1,762,875, approximately $833 per square foot. 3024 Mcgraw St is a home located in San Diego County with nearby schools including Toler Elementary School, Marston Middle School, and Clairemont High School.
Ownership History
Date
Name
Owned For
Owner Type
Purchase Details
Closed on
Feb 9, 2024
Sold by
Koenig Family Trust
Bought by
Monsef Reza and Masaeli Negin
Current Estimated Value
Home Financials for this Owner
Home Financials are based on the most recent Mortgage that was taken out on this home.
Original Mortgage
$1,165,500
Outstanding Balance
$1,150,590
Interest Rate
6.63%
Mortgage Type
New Conventional
Estimated Equity
$612,285
Purchase Details
Closed on
Aug 10, 2005
Sold by
Koenig Thomas F and Koenig Joyce
Bought by
Koenig Thomas F and Koenig Joyce
Home Financials for this Owner
Home Financials are based on the most recent Mortgage that was taken out on this home.
Original Mortgage
$73,700
Interest Rate
5.64%
Mortgage Type
Stand Alone Refi Refinance Of Original Loan
Purchase Details
Closed on
Aug 7, 1996
Sold by
Thomas Koenig
Bought by
Koenig Thomas F and Koenig Joyce
Purchase Details
Closed on
Oct 12, 1989
Purchase Details
Closed on
Jul 18, 1986
Purchase Details
Closed on
May 1, 1986
Create a Home Valuation Report for This Property
The Home Valuation Report is an in-depth analysis detailing your home's value as well as a comparison with similar homes in the area
Home Values in the Area
Average Home Value in this Area
Purchase History
| Date | Buyer | Sale Price | Title Company |
|---|---|---|---|
| Monsef Reza | $1,665,000 | Lawyers Title Company | |
| Koenig Thomas F | -- | Chicago Title Co | |
| Koenig Thomas F | -- | Chicago Title Co | |
| Koenig Thomas F | -- | -- | |
| -- | $356,500 | -- | |
| -- | $202,000 | -- | |
| -- | $175,000 | -- |
Source: Public Records
Mortgage History
| Date | Status | Borrower | Loan Amount |
|---|---|---|---|
| Open | Monsef Reza | $1,165,500 | |
| Previous Owner | Koenig Thomas F | $73,700 |
Source: Public Records
Tax History Compared to Growth
Tax History
| Year | Tax Paid | Tax Assessment Tax Assessment Total Assessment is a certain percentage of the fair market value that is determined by local assessors to be the total taxable value of land and additions on the property. | Land | Improvement |
|---|---|---|---|---|
| 2024 | $8,681 | $710,987 | $459,759 | $251,228 |
| 2023 | $8,487 | $697,047 | $450,745 | $246,302 |
| 2022 | $8,260 | $683,380 | $441,907 | $241,473 |
| 2021 | $8,202 | $669,982 | $433,243 | $236,739 |
| 2020 | $8,102 | $663,113 | $428,801 | $234,312 |
| 2019 | $7,956 | $650,112 | $420,394 | $229,718 |
| 2018 | $7,437 | $637,365 | $412,151 | $225,214 |
| 2017 | $7,259 | $624,869 | $404,070 | $220,799 |
| 2016 | $7,141 | $612,618 | $396,148 | $216,470 |
| 2015 | $7,035 | $603,417 | $390,198 | $213,219 |
| 2014 | $6,923 | $591,598 | $382,555 | $209,043 |
Source: Public Records
Map
Nearby Homes
- 3008 Serbian Place
- 3025 Chicago St
- 3182 Denver St
- 3732 Baker St
- 3115 Geronimo Ave
- 2419 Chicago St
- 0000 Astor Unit 2
- 2812 Clairemont Ct
- 4654-56 Blackfoot Ave
- 2514 Galveston St
- 3551 Paul Jones Ave
- 2676 Illion St
- 3546 Trenton Ave
- 4821 Iroquois Ave
- 425 042-25-00 Trenton Ave
- 425 042-26-00 Trenton Ave
- 425 042-27-00 Trenton Ave
- 4770 Jellett St
- 4044 Via Del Conquistador
- 4521 Misty Place