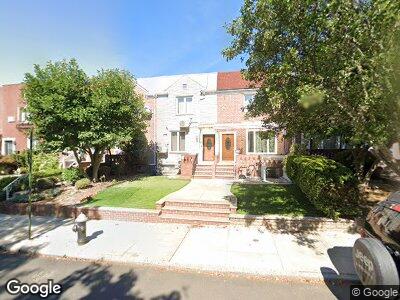
318 Bay 14th St Brooklyn, NY 11214
Bath Beach NeighborhoodEstimated Value: $879,000 - $1,019,000
--
Bed
--
Bath
928
Sq Ft
$997/Sq Ft
Est. Value
About This Home
This home is located at 318 Bay 14th St, Brooklyn, NY 11214 and is currently estimated at $924,923, approximately $996 per square foot. 318 Bay 14th St is a home located in Kings County with nearby schools including P.S. 163 Bath Beach, St Bernadette School, and Elite Academy of Science & Technology (EAST).
Ownership History
Date
Name
Owned For
Owner Type
Purchase Details
Closed on
Jan 13, 2021
Sold by
Lin Yi Chun and Teng Chen Tien
Bought by
Guan Xiaoyi
Current Estimated Value
Home Financials for this Owner
Home Financials are based on the most recent Mortgage that was taken out on this home.
Original Mortgage
$581,000
Interest Rate
3.22%
Mortgage Type
Purchase Money Mortgage
Purchase Details
Closed on
Feb 27, 2016
Sold by
Lin Steve
Bought by
Lin Yi Chun and Teng Chen Tien
Purchase Details
Closed on
Feb 7, 2011
Sold by
Zhang Wu Jin
Bought by
Lin Steve and Lin Yi Chun
Home Financials for this Owner
Home Financials are based on the most recent Mortgage that was taken out on this home.
Original Mortgage
$416,000
Interest Rate
4.88%
Mortgage Type
Purchase Money Mortgage
Purchase Details
Closed on
Jul 15, 2010
Sold by
Cozzolino As Executor Vincent
Bought by
Wu Jin Zhang and Zhao Li Yi
Create a Home Valuation Report for This Property
The Home Valuation Report is an in-depth analysis detailing your home's value as well as a comparison with similar homes in the area
Home Values in the Area
Average Home Value in this Area
Purchase History
| Date | Buyer | Sale Price | Title Company |
|---|---|---|---|
| Guan Xiaoyi | $830,000 | -- | |
| Lin Yi Chun | -- | -- | |
| Lin Steve | $520,000 | -- | |
| Wu Jin Zhang | $395,000 | -- |
Source: Public Records
Mortgage History
| Date | Status | Borrower | Loan Amount |
|---|---|---|---|
| Previous Owner | Guan Xiaoyi | $581,000 | |
| Previous Owner | Lin | $5,328 | |
| Previous Owner | Lin Steve | $416,000 |
Source: Public Records
Tax History Compared to Growth
Tax History
| Year | Tax Paid | Tax Assessment Tax Assessment Total Assessment is a certain percentage of the fair market value that is determined by local assessors to be the total taxable value of land and additions on the property. | Land | Improvement |
|---|---|---|---|---|
| 2024 | $7,628 | $50,520 | $10,020 | $40,500 |
| 2023 | $7,277 | $52,560 | $10,020 | $42,540 |
| 2022 | $5,365 | $45,900 | $10,020 | $35,880 |
| 2021 | $7,146 | $46,620 | $10,020 | $36,600 |
| 2020 | $6,805 | $51,900 | $10,020 | $41,880 |
| 2019 | $6,328 | $49,800 | $10,020 | $39,780 |
| 2018 | $5,789 | $29,859 | $6,984 | $22,875 |
| 2017 | $5,787 | $29,859 | $8,283 | $21,576 |
| 2016 | $5,614 | $29,631 | $9,646 | $19,985 |
| 2015 | $3,178 | $27,955 | $9,811 | $18,144 |
| 2014 | $3,178 | $26,374 | $10,135 | $16,239 |
Source: Public Records
Map
Nearby Homes
- 1155 Shore Pkwy
- 283 Bay 14th St
- 8884 17th Ave
- 1259 Shore Pkwy Unit 3A
- 8895 Bay 16th St Unit 2b
- 304 Bay 17th St Unit 3A
- 8857 16th Ave
- 307 Bay 11th St
- 1079 Shore Pkwy Unit 1B
- 306 Bay 11th St
- 8820 Bay 16th St
- 247 Bay 11th St
- 315 Bay 10th St
- 8844 18th Ave
- 8794 17th Ave Unit 301
- 1531 Independence Ave Unit 2
- 284 Bay 19th St Unit A
- 310 Bay 10th St
- 306 Bay 10th St
- 298 Bay 10th St