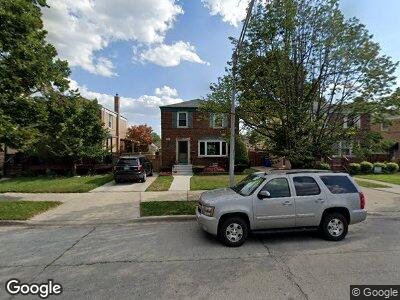
3411 W 112th Place Chicago, IL 60655
Mount Greenwood NeighborhoodEstimated Value: $275,000 - $328,000
3
Beds
1
Bath
1,156
Sq Ft
$258/Sq Ft
Est. Value
About This Home
This home is located at 3411 W 112th Place, Chicago, IL 60655 and is currently estimated at $298,225, approximately $257 per square foot. 3411 W 112th Place is a home located in Cook County with nearby schools including George F Cassell Elementary School, Morgan Park High School, and St. Christina School.
Ownership History
Date
Name
Owned For
Owner Type
Purchase Details
Closed on
Apr 20, 2021
Sold by
Garvey Michael A
Bought by
Garvey Sheila K
Current Estimated Value
Home Financials for this Owner
Home Financials are based on the most recent Mortgage that was taken out on this home.
Original Mortgage
$185,500
Interest Rate
3.87%
Mortgage Type
New Conventional
Purchase Details
Closed on
May 31, 2001
Sold by
Moran Thomas
Bought by
Garvey Michael A
Home Financials for this Owner
Home Financials are based on the most recent Mortgage that was taken out on this home.
Original Mortgage
$139,500
Interest Rate
7.18%
Purchase Details
Closed on
Mar 29, 1994
Sold by
Galvan Michael and Galvan Kimberly
Bought by
Moran Thomas J
Home Financials for this Owner
Home Financials are based on the most recent Mortgage that was taken out on this home.
Original Mortgage
$101,178
Interest Rate
7.35%
Create a Home Valuation Report for This Property
The Home Valuation Report is an in-depth analysis detailing your home's value as well as a comparison with similar homes in the area
Home Values in the Area
Average Home Value in this Area
Purchase History
| Date | Buyer | Sale Price | Title Company |
|---|---|---|---|
| Garvey Sheila K | -- | Attorney | |
| Garvey Michael A | $155,000 | Chicago Title Insurance Co | |
| Moran Thomas J | $73,333 | Land Title Group Inc |
Source: Public Records
Mortgage History
| Date | Status | Borrower | Loan Amount |
|---|---|---|---|
| Open | Garvey Sheila X | $209,000 | |
| Closed | Garvey Sheila K | $185,500 | |
| Closed | Garvey Michael A | $20,000 | |
| Closed | Garvey Michael A | $136,000 | |
| Closed | Garvey Michael A | $139,500 | |
| Previous Owner | Moran Thomas J | $101,178 |
Source: Public Records
Tax History Compared to Growth
Tax History
| Year | Tax Paid | Tax Assessment Tax Assessment Total Assessment is a certain percentage of the fair market value that is determined by local assessors to be the total taxable value of land and additions on the property. | Land | Improvement |
|---|---|---|---|---|
| 2024 | $3,627 | $27,000 | $6,934 | $20,066 |
| 2023 | $3,627 | $21,000 | $5,547 | $15,453 |
| 2022 | $3,627 | $21,000 | $5,547 | $15,453 |
| 2021 | $3,563 | $21,000 | $5,547 | $15,453 |
| 2020 | $4,036 | $21,177 | $5,269 | $15,908 |
| 2019 | $3,997 | $23,272 | $5,269 | $18,003 |
| 2018 | $3,928 | $23,272 | $5,269 | $18,003 |
| 2017 | $3,681 | $20,437 | $4,714 | $15,723 |
| 2016 | $3,602 | $20,437 | $4,714 | $15,723 |
| 2015 | $3,272 | $20,437 | $4,714 | $15,723 |
| 2014 | $3,116 | $19,320 | $4,437 | $14,883 |
| 2013 | $3,043 | $19,320 | $4,437 | $14,883 |
Source: Public Records
Map
Nearby Homes
- 3347 W 112th Place
- 11208 S Christiana Ave
- 11202 S Christiana Ave
- 11128 S Christiana Ave
- 11205 S Drake Ave
- 11103 S Saint Louis Ave Unit 303
- 11247 S Central Park Ave
- 11211 S Central Park Ave
- 3254 W 115th St
- 11025 S Kedzie Ave
- 11217 S Albany Ave
- 11246 S Whipple St
- 11621 S Merrion Ln
- 3162 W Meadow Lane Dr Unit 1
- 11636 S Merrion Ln
- 11055 S Hamlin Ave Unit 1
- 3748 W 115th St
- 10925 S Troy St
- 10945 S Ridgeway Ave
- 3427 W 117th St