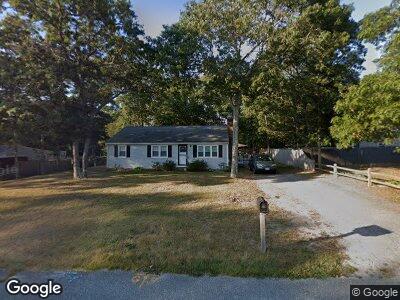
40 Somerset Rd Mashpee, MA 02649
Mashpee NeighborhoodEstimated Value: $454,000 - $583,000
3
Beds
1
Bath
1,500
Sq Ft
$335/Sq Ft
Est. Value
About This Home
This home is located at 40 Somerset Rd, Mashpee, MA 02649 and is currently estimated at $502,078, approximately $334 per square foot. 40 Somerset Rd is a home located in Barnstable County with nearby schools including Kenneth C. Coombs School, Quashnet School, and Mashpee Middle School.
Ownership History
Date
Name
Owned For
Owner Type
Purchase Details
Closed on
Feb 14, 2008
Sold by
Rafferty Teresa M
Bought by
40 Somerset Road Rt and Rafferty Teresa M
Current Estimated Value
Purchase Details
Closed on
Apr 27, 2007
Sold by
40 Somerset Road Rt and Rafferty Teresa
Bought by
Rafferty Teresa M
Home Financials for this Owner
Home Financials are based on the most recent Mortgage that was taken out on this home.
Original Mortgage
$115,000
Interest Rate
6.18%
Mortgage Type
Purchase Money Mortgage
Purchase Details
Closed on
Jul 19, 1993
Sold by
Fhlmc
Bought by
Hull Joseph M and Rafferty Teresa
Home Financials for this Owner
Home Financials are based on the most recent Mortgage that was taken out on this home.
Original Mortgage
$51,200
Interest Rate
7.4%
Mortgage Type
Purchase Money Mortgage
Purchase Details
Closed on
Apr 16, 1993
Sold by
Wells Michael D and Sentry Federal Sb
Bought by
Fhlmc
Create a Home Valuation Report for This Property
The Home Valuation Report is an in-depth analysis detailing your home's value as well as a comparison with similar homes in the area
Home Values in the Area
Average Home Value in this Area
Purchase History
| Date | Buyer | Sale Price | Title Company |
|---|---|---|---|
| 40 Somerset Road Rt | -- | -- | |
| Rafferty Teresa M | -- | -- | |
| Hull Joseph M | $64,000 | -- | |
| Fhlmc | $55,250 | -- |
Source: Public Records
Mortgage History
| Date | Status | Borrower | Loan Amount |
|---|---|---|---|
| Open | Fhlmc | $112,500 | |
| Previous Owner | Rafferty Teresa M | $115,000 | |
| Previous Owner | Rafferty Teresa | $212,000 | |
| Previous Owner | Fhlmc | $51,200 |
Source: Public Records
Tax History Compared to Growth
Tax History
| Year | Tax Paid | Tax Assessment Tax Assessment Total Assessment is a certain percentage of the fair market value that is determined by local assessors to be the total taxable value of land and additions on the property. | Land | Improvement |
|---|---|---|---|---|
| 2024 | $2,675 | $416,000 | $168,700 | $247,300 |
| 2023 | $2,526 | $360,400 | $160,600 | $199,800 |
| 2022 | $2,399 | $293,600 | $130,600 | $163,000 |
| 2021 | $2,299 | $253,500 | $117,600 | $135,900 |
| 2020 | $2,217 | $243,900 | $113,100 | $130,800 |
| 2019 | $2,120 | $234,200 | $113,100 | $121,100 |
| 2018 | $0 | $216,800 | $113,100 | $103,700 |
| 2017 | $0 | $205,700 | $113,100 | $92,600 |
| 2016 | $1,840 | $199,100 | $113,100 | $86,000 |
| 2015 | $1,770 | $194,300 | $113,100 | $81,200 |
| 2014 | $1,810 | $192,800 | $111,700 | $81,100 |
Source: Public Records
Map
Nearby Homes
- 7 Somerset Rd
- 12 Black Watch Way
- 314 Meiggs Backus Rd
- 7 Santuit Pond Rd
- 35 Santuit Pond Way Unit 8C
- 35 Santuit Pond Way Unit 11B
- 68 Fox Hill Rd
- 22 Candlewood Ln
- 17 Silver Leaf Ln
- 62 Santuit Pond Rd
- 14 Sarah Lawrence Rd
- 12 Abigails Way
- 53 Deer Ridge Rd
- 85 Reflection Dr
- 724 Cotuit Rd
- 90 Lakewood Dr
- 49 Head of Pond Rd
- 4 Inkberry Cir
- 66 Holly Ridge Dr
- 275 Lake Shore Dr