
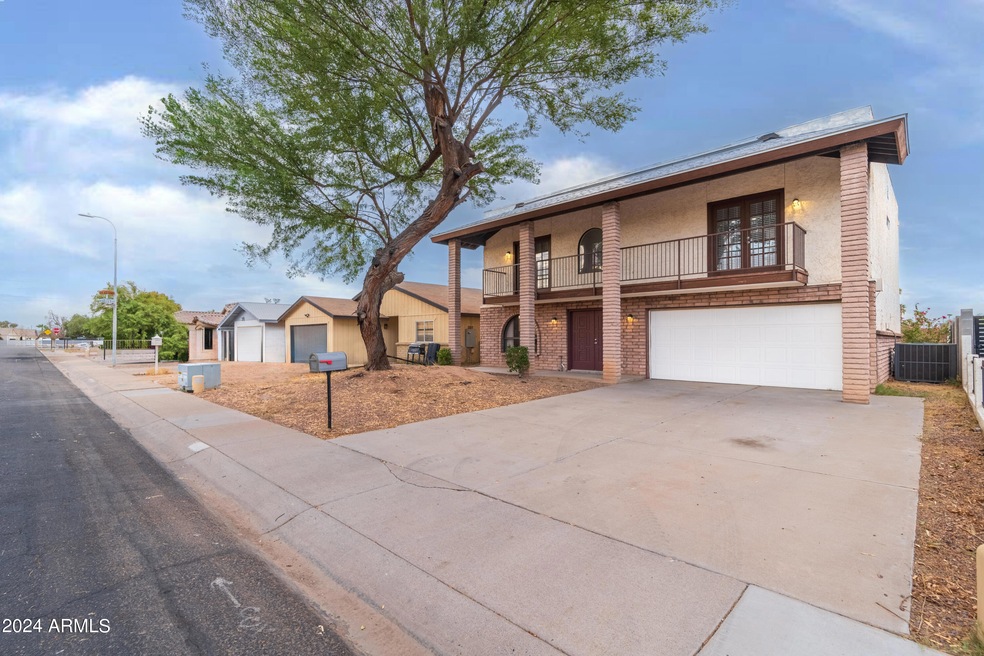
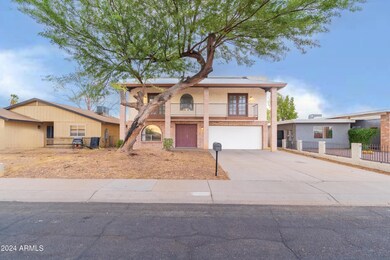
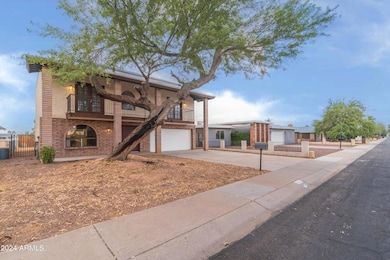
4439 N 106th Ave Phoenix, AZ 85037
Villa de Paz Neighborhood
3
Beds
3
Baths
2,435
Sq Ft
5,001
Sq Ft Lot
Highlights
- 1 Fireplace
- Covered patio or porch
- Eat-In Kitchen
- No HOA
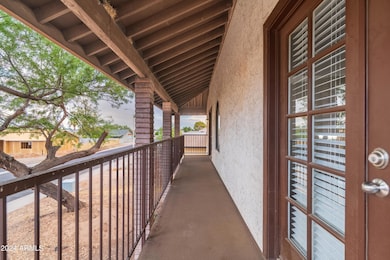
- Balcony
- Refrigerated Cooling System
About This Home
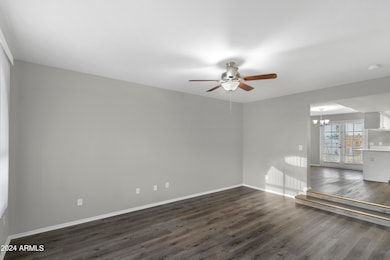
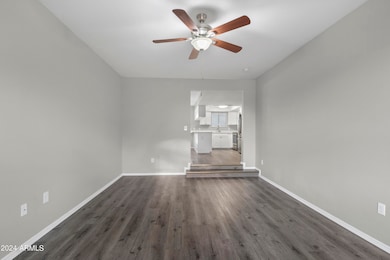
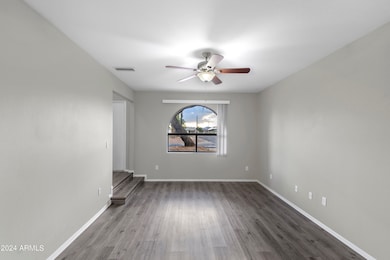
As of March 2025Welcome to your future home! This charming two-story gem features a two-car attached garage and is nestled on a generously sized lot with a backyard that's a blank slate—ready for you to bring your vision to life. Step inside to discover a beautifully maintained interior with sleek laminate wood floors and a fresh, neutral paint palette that brightens every room. The spacious layout is perfect for both entertaining and everyday living, offering plenty of room to grow. Located in a vibrant community with a wealth of amenities, including restaurants and shopping just moments away, this home combines comfort and convenience in one perfect package. Imagine the possibilities!
Home Details
Home Type
- Single Family
Est. Annual Taxes
- $1,613
Year Built
- Built in 1983
Lot Details
- 5,001 Sq Ft Lot
- Block Wall Fence
Parking
- 2 Car Garage
Home Design
- Wood Frame Construction
- Composition Roof
- Stucco
Interior Spaces
- 2,435 Sq Ft Home
- 2-Story Property
- 1 Fireplace
- Vinyl Flooring
- Eat-In Kitchen
- Washer and Dryer Hookup
Bedrooms and Bathrooms
- 3 Bedrooms
- Primary Bathroom is a Full Bathroom
- 3 Bathrooms
Outdoor Features
- Balcony
- Covered patio or porch
Schools
- Pendergast Elementary School
- Villa De Paz Elementary Middle School
- Westview High School
Utilities
- Refrigerated Cooling System
- Heating Available
Community Details
- No Home Owners Association
- Association fees include no fees
- Villa De Paz Unit 2 Subdivision
Listing and Financial Details
- Tax Lot 293
- Assessor Parcel Number 102-17-312
Map
Create a Home Valuation Report for This Property
The Home Valuation Report is an in-depth analysis detailing your home's value as well as a comparison with similar homes in the area
Home Values in the Area
Average Home Value in this Area
Property History
| Date | Event | Price | Change | Sq Ft Price |
|---|---|---|---|---|
| 03/05/2025 03/05/25 | Sold | $369,000 | -0.2% | $152 / Sq Ft |
| 01/16/2025 01/16/25 | Pending | -- | -- | -- |
| 11/29/2024 11/29/24 | For Sale | $369,900 | +0.2% | $152 / Sq Ft |
| 11/28/2024 11/28/24 | Off Market | $369,000 | -- | -- |
| 11/21/2024 11/21/24 | Price Changed | $369,900 | -1.3% | $152 / Sq Ft |
| 11/15/2024 11/15/24 | Price Changed | $374,900 | -3.8% | $154 / Sq Ft |
| 10/30/2024 10/30/24 | Price Changed | $389,900 | -2.5% | $160 / Sq Ft |
| 10/14/2024 10/14/24 | Price Changed | $399,900 | -2.4% | $164 / Sq Ft |
| 09/27/2024 09/27/24 | Price Changed | $409,900 | -4.7% | $168 / Sq Ft |
| 08/29/2024 08/29/24 | For Sale | $429,900 | 0.0% | $177 / Sq Ft |
| 03/13/2023 03/13/23 | Rented | $2,245 | -2.0% | -- |
| 02/13/2023 02/13/23 | Under Contract | -- | -- | -- |
| 02/06/2023 02/06/23 | Price Changed | $2,290 | -0.9% | $1 / Sq Ft |
| 01/31/2023 01/31/23 | For Rent | $2,310 | +28.7% | -- |
| 12/03/2019 12/03/19 | Rented | $1,795 | 0.0% | -- |
| 11/21/2019 11/21/19 | Under Contract | -- | -- | -- |
| 11/18/2019 11/18/19 | Price Changed | $1,795 | -0.3% | $1 / Sq Ft |
| 11/14/2019 11/14/19 | Price Changed | $1,800 | +0.6% | $1 / Sq Ft |
| 11/01/2019 11/01/19 | Price Changed | $1,790 | -0.3% | $1 / Sq Ft |
| 10/18/2019 10/18/19 | For Rent | $1,795 | +79.5% | -- |
| 12/01/2013 12/01/13 | Rented | $1,000 | 0.0% | -- |
| 11/29/2013 11/29/13 | Under Contract | -- | -- | -- |
| 09/09/2013 09/09/13 | For Rent | $1,000 | 0.0% | -- |
| 05/31/2013 05/31/13 | Sold | $129,900 | +3.9% | $53 / Sq Ft |
| 04/17/2013 04/17/13 | Pending | -- | -- | -- |
| 04/15/2013 04/15/13 | Price Changed | $125,000 | -10.7% | $51 / Sq Ft |
| 12/01/2012 12/01/12 | Price Changed | $139,900 | -6.7% | $57 / Sq Ft |
| 10/02/2012 10/02/12 | Price Changed | $149,900 | -11.8% | $62 / Sq Ft |
| 07/29/2012 07/29/12 | For Sale | $170,000 | -- | $70 / Sq Ft |
Source: Arizona Regional Multiple Listing Service (ARMLS)
Tax History
| Year | Tax Paid | Tax Assessment Tax Assessment Total Assessment is a certain percentage of the fair market value that is determined by local assessors to be the total taxable value of land and additions on the property. | Land | Improvement |
|---|---|---|---|---|
| 2025 | $1,589 | $10,950 | -- | -- |
| 2024 | $1,613 | $10,428 | -- | -- |
| 2023 | $1,613 | $27,300 | $5,460 | $21,840 |
| 2022 | $1,552 | $20,030 | $4,000 | $16,030 |
| 2021 | $1,487 | $19,920 | $3,980 | $15,940 |
| 2020 | $1,445 | $18,410 | $3,680 | $14,730 |
| 2019 | $1,433 | $16,010 | $3,200 | $12,810 |
| 2018 | $1,352 | $14,420 | $2,880 | $11,540 |
| 2017 | $1,267 | $13,950 | $2,790 | $11,160 |
| 2016 | $1,170 | $13,000 | $2,600 | $10,400 |
| 2015 | $1,130 | $11,130 | $2,220 | $8,910 |
Source: Public Records
Mortgage History
| Date | Status | Loan Amount | Loan Type |
|---|---|---|---|
| Open | $362,316 | FHA | |
| Previous Owner | $59,368 | Unknown |
Source: Public Records
Deed History
| Date | Type | Sale Price | Title Company |
|---|---|---|---|
| Special Warranty Deed | -- | Servicelink | |
| Cash Sale Deed | $125,000 | Yavapai Title Agency Inc | |
| Interfamily Deed Transfer | -- | -- |
Source: Public Records
Similar Homes in the area
Source: Arizona Regional Multiple Listing Service (ARMLS)
MLS Number: 6751824
APN: 102-17-312
Disclaimer: Certain information contained herein is derived from information provided by parties other than Homes.com. All information provided is deemed reliable, but is not guaranteed to be accurate and should be independently verified.
![]() All information should be verified by the recipient and none is guaranteed as accurate by ARMLS
All information should be verified by the recipient and none is guaranteed as accurate by ARMLS
Listing Information presented by local MLS brokerage: Ten-X, local REALTOR®- Arlene Richardson - (888)-952-6393
Nearby Homes
- 10619 W Sells Dr
- 10705 W Montecito Ave
- 4120 N 105th Dr
- 10472 W Devonshire Ave
- 10216 W Minnezona Ave
- 10461 W Devonshire Ave
- 10436 W Devonshire Ave
- 10817 W Pierson St
- 10224 W Highland Ave
- 10202 W Coolidge St
- 10208 W Highland Ave
- 10515 W Pasadena Ave
- 4601 N 102nd Ave Unit 1100
- 4601 N 102nd Ave Unit 1036
- 10265 W Camelback Rd Unit 125
- 10938 W Pierson St
- 10138 W Highland Ave
- 4626 N 111th Ln Unit 2
- 4406 N 111th Dr
- 4247 N 101st Ave