
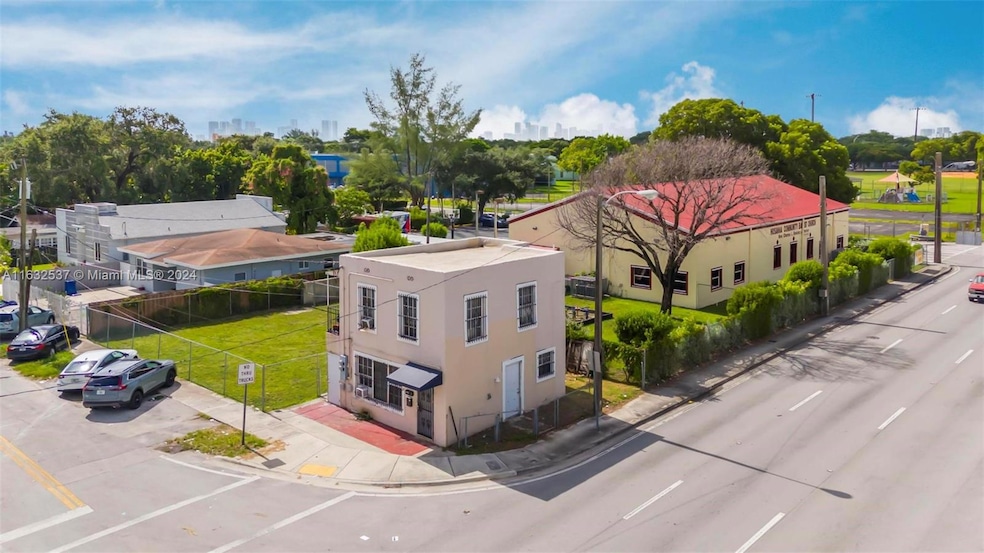

5695 NW 22nd Ave Miami, FL 33142
Brownsville NeighborhoodEstimated payment $2,669/month
Total Views
5,242
--
Bed
--
Bath
1,066
Sq Ft
$394
Price per Sq Ft
Highlights
- No HOA
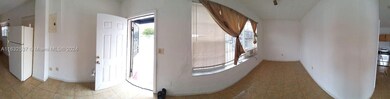
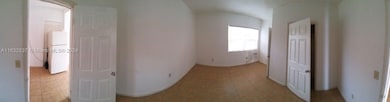
- Tile Flooring
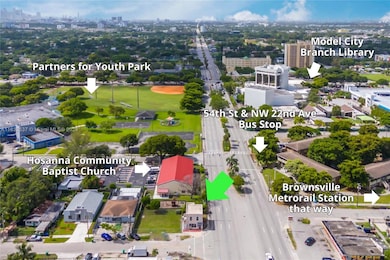
- 1-minute walk to Partners For Youth Park
- Cooling System Mounted To A Wall/Window
- Heating System Mounted To A Wall or Window
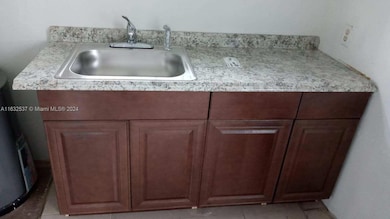
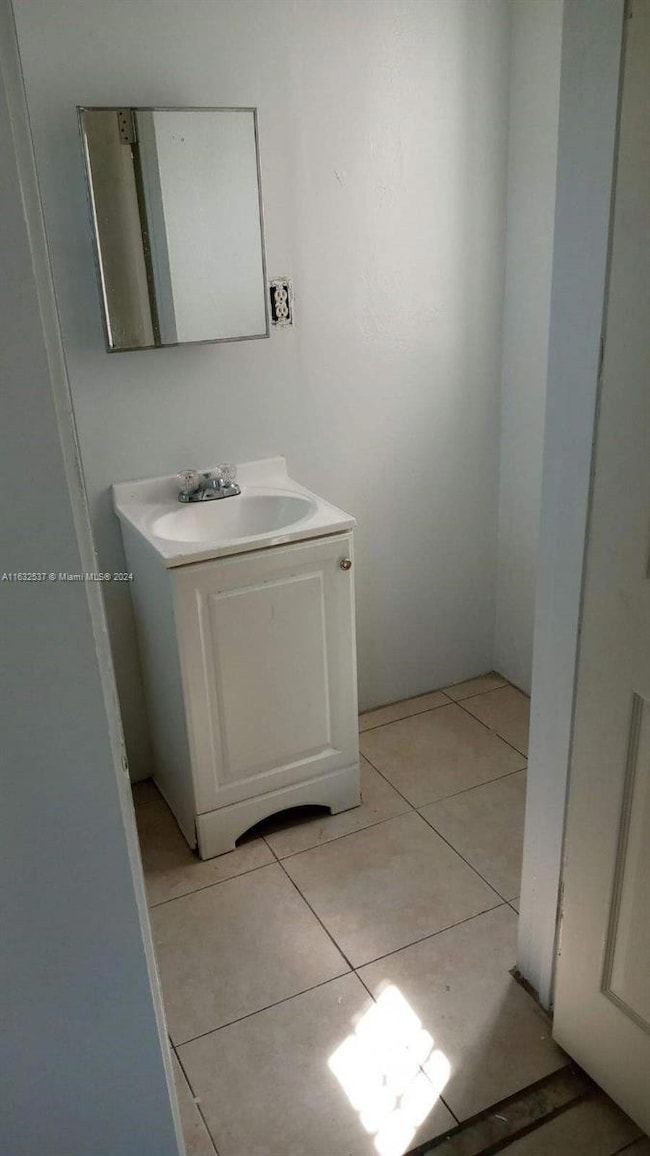
About This Home
Great investment opportunity! Located in a Florida Opportunity Zone - potential to redeem up to 3 tax benefits. Promising Multifamily development opportunity situated within walking distance from the Metrorail, bus, parks, and library. Comprised of two separate 1 bed, 1 bath units - 1/1 on first level and 1/1 on the second level. $3,000 monthly gross income, currently both units are occupied. Units will only be shown during inspection period once an offer is accepted.
Property Details
Home Type
- Multi-Family
Est. Annual Taxes
- $3,901
Year Built
- Built in 1942
Home Design
- Duplex
Interior Spaces
- 1,066 Sq Ft Home
- 2-Story Property
- Tile Flooring
Utilities
- Cooling System Mounted To A Wall/Window
- Heating System Mounted To A Wall or Window
Community Details
- No Home Owners Association
- 2 Units
- Floral Heights Sec B Condos
- Floral Heights Sec B Subdivision
Listing and Financial Details
- Assessor Parcel Number 30-31-15-024-0310
Map
Create a Home Valuation Report for This Property
The Home Valuation Report is an in-depth analysis detailing your home's value as well as a comparison with similar homes in the area
Home Values in the Area
Average Home Value in this Area
Tax History
| Year | Tax Paid | Tax Assessment Tax Assessment Total Assessment is a certain percentage of the fair market value that is determined by local assessors to be the total taxable value of land and additions on the property. | Land | Improvement |
|---|---|---|---|---|
| 2024 | $3,901 | $161,539 | $44,550 | $116,989 |
| 2023 | $3,901 | $163,163 | $44,550 | $118,613 |
| 2022 | $3,604 | $149,938 | $29,700 | $120,238 |
| 2021 | $2,715 | $97,484 | $19,305 | $78,179 |
| 2020 | $2,687 | $95,630 | $16,335 | $79,295 |
| 2019 | $2,653 | $93,461 | $13,365 | $80,096 |
| 2018 | $2,589 | $94,573 | $13,365 | $81,208 |
| 2017 | $2,634 | $95,686 | $0 | $0 |
| 2016 | $1,844 | $53,068 | $0 | $0 |
| 2015 | $1,396 | $27,070 | $0 | $0 |
| 2014 | -- | $28,072 | $0 | $0 |
Source: Public Records
Property History
| Date | Event | Price | Change | Sq Ft Price |
|---|---|---|---|---|
| 07/31/2024 07/31/24 | For Sale | $420,000 | +61.5% | $394 / Sq Ft |
| 02/19/2021 02/19/21 | Sold | $260,000 | 0.0% | $244 / Sq Ft |
| 02/03/2021 02/03/21 | Pending | -- | -- | -- |
| 01/28/2021 01/28/21 | For Sale | $260,000 | +59.5% | $244 / Sq Ft |
| 04/05/2019 04/05/19 | Sold | $163,000 | -8.4% | $153 / Sq Ft |
| 03/18/2019 03/18/19 | Pending | -- | -- | -- |
| 03/16/2019 03/16/19 | Price Changed | $178,000 | +4.8% | $167 / Sq Ft |
| 03/16/2019 03/16/19 | For Sale | $169,900 | 0.0% | $159 / Sq Ft |
| 02/26/2019 02/26/19 | Pending | -- | -- | -- |
| 02/14/2019 02/14/19 | Price Changed | $169,900 | -7.2% | $159 / Sq Ft |
| 02/08/2019 02/08/19 | Price Changed | $183,000 | +1.7% | $172 / Sq Ft |
| 01/28/2019 01/28/19 | Price Changed | $179,999 | -2.2% | $169 / Sq Ft |
| 01/26/2019 01/26/19 | Price Changed | $184,000 | -4.7% | $173 / Sq Ft |
| 01/14/2019 01/14/19 | Price Changed | $193,000 | -0.5% | $181 / Sq Ft |
| 01/07/2019 01/07/19 | Price Changed | $194,000 | -1.0% | $182 / Sq Ft |
| 12/24/2018 12/24/18 | Price Changed | $196,000 | -1.5% | $184 / Sq Ft |
| 12/07/2018 12/07/18 | For Sale | $199,000 | 0.0% | $187 / Sq Ft |
| 07/21/2017 07/21/17 | Rented | $875 | -1.7% | -- |
| 07/17/2017 07/17/17 | Price Changed | $890 | 0.0% | $1 / Sq Ft |
| 06/23/2017 06/23/17 | Sold | $174,000 | 0.0% | $163 / Sq Ft |
| 06/22/2017 06/22/17 | Price Changed | $174,000 | 0.0% | $163 / Sq Ft |
| 06/21/2017 06/21/17 | For Rent | $900 | 0.0% | -- |
| 06/07/2017 06/07/17 | Pending | -- | -- | -- |
| 05/24/2017 05/24/17 | Price Changed | $182,300 | -1.1% | $171 / Sq Ft |
| 03/17/2017 03/17/17 | For Sale | $184,300 | +30.2% | $173 / Sq Ft |
| 06/03/2016 06/03/16 | Sold | $141,500 | -5.0% | $133 / Sq Ft |
| 05/11/2016 05/11/16 | Pending | -- | -- | -- |
| 04/24/2016 04/24/16 | For Sale | $149,000 | +129.2% | $140 / Sq Ft |
| 01/30/2015 01/30/15 | Sold | $65,000 | +13.0% | $68 / Sq Ft |
| 12/31/2014 12/31/14 | Pending | -- | -- | -- |
| 12/16/2014 12/16/14 | For Sale | $57,500 | -- | $60 / Sq Ft |
Source: MIAMI REALTORS® MLS
Deed History
| Date | Type | Sale Price | Title Company |
|---|---|---|---|
| Warranty Deed | $260,000 | Sunny Title Company | |
| Warranty Deed | $163,000 | Greentree Title Llc | |
| Special Warranty Deed | $174,000 | Attorney | |
| Warranty Deed | $141,500 | A & A Title Services Llc | |
| Deed | $100 | -- | |
| Warranty Deed | $65,000 | All Lorida Title Co Inc | |
| Warranty Deed | $55,000 | All Florida Title Co Inc | |
| Quit Claim Deed | $28,500 | All Florida Title Co Inc | |
| Trustee Deed | $40,200 | None Available |
Source: Public Records
Mortgage History
| Date | Status | Loan Amount | Loan Type |
|---|---|---|---|
| Previous Owner | $130,400 | Adjustable Rate Mortgage/ARM | |
| Previous Owner | $101,600 | Fannie Mae Freddie Mac |
Source: Public Records
Similar Homes in the area
Source: MIAMI REALTORS® MLS
MLS Number: A11632537
APN: 30-3115-024-0310
Disclaimer: Certain information contained herein is derived from information provided by parties other than Homes.com. All information provided is deemed reliable, but is not guaranteed to be accurate and should be independently verified.
![]() IDX information is provided exclusively for personal, non-commercial use, and may not be used for any purpose other than to identify prospective properties consumers may be interested in purchasing. Information is deemed reliable but not guaranteed.
IDX information is provided exclusively for personal, non-commercial use, and may not be used for any purpose other than to identify prospective properties consumers may be interested in purchasing. Information is deemed reliable but not guaranteed.
Nearby Homes
- 0 NW 56th St
- 2230 NW 58th St
- 2254 NW 58th St
- 2180 NW 59th St
- 2151 NW 59th St
- 1971 NW 57th St
- 2221 NW 59th St
- 2326 NW 56th St
- 1928 NW 58th St
- 2326 NW 59th St
- 5933 NW 21st Ave
- 1920 NW 55th Terrace
- 2320 NW 55th St
- 2356 NW 55th Terrace
- 1980 NW 54th St
- 2154 NW 61st St
- 2232 NW 61st St
- 2011 NW 53rd St
- 5531 NW 24th Ave
- 1895 NW 58th St