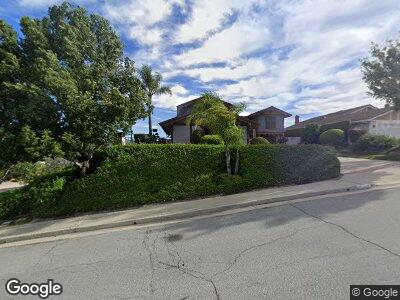
600 S Pathfinder Trail Anaheim, CA 92807
Anaheim Hills NeighborhoodEstimated Value: $1,374,000 - $1,510,000
4
Beds
3
Baths
2,667
Sq Ft
$548/Sq Ft
Est. Value
About This Home
This home is located at 600 S Pathfinder Trail, Anaheim, CA 92807 and is currently estimated at $1,462,823, approximately $548 per square foot. 600 S Pathfinder Trail is a home located in Orange County with nearby schools including Imperial Elementary School, Canyon High School, and El Rancho Charter.
Ownership History
Date
Name
Owned For
Owner Type
Purchase Details
Closed on
Dec 4, 2020
Sold by
Oblonsky Tomas and Oblonsky Tinsley J
Bought by
Oblonsky Tomas and Oblonsky Tinsley J
Current Estimated Value
Home Financials for this Owner
Home Financials are based on the most recent Mortgage that was taken out on this home.
Original Mortgage
$750,000
Outstanding Balance
$682,444
Interest Rate
2.8%
Mortgage Type
New Conventional
Estimated Equity
$788,632
Purchase Details
Closed on
Jun 20, 1993
Sold by
Carey Zetoun and Bailey Delbert Kane
Bought by
Oblonsky Tomas and Oblonsky Janice S
Home Financials for this Owner
Home Financials are based on the most recent Mortgage that was taken out on this home.
Original Mortgage
$281,500
Interest Rate
7.34%
Create a Home Valuation Report for This Property
The Home Valuation Report is an in-depth analysis detailing your home's value as well as a comparison with similar homes in the area
Home Values in the Area
Average Home Value in this Area
Purchase History
| Date | Buyer | Sale Price | Title Company |
|---|---|---|---|
| Oblonsky Tomas | -- | Solidifi Us Inc | |
| Oblonsky Tomas | -- | Chicago Title Company |
Source: Public Records
Mortgage History
| Date | Status | Borrower | Loan Amount |
|---|---|---|---|
| Open | Oblonsky Tomas | $750,000 | |
| Closed | Oblonsky Tomas | $745,000 | |
| Closed | Oblonsky Tomas | $60,000 | |
| Closed | Oblonsky Tomas | $703,000 | |
| Closed | Oblonsky Tomas | $741,772 | |
| Closed | Oblonsky Tomas | $740,696 | |
| Closed | Oblonsky Tomas | $740,696 | |
| Closed | Oblonsky Tomas | $732,037 | |
| Closed | Oblonsky Tomas | $665,000 | |
| Closed | Oblonsky Tomas | $561,000 | |
| Closed | Oblonsky Tomas | $44,000 | |
| Closed | Oblonsky Tomas | $431,250 | |
| Closed | Oblonsky Tomas | $281,500 |
Source: Public Records
Tax History Compared to Growth
Tax History
| Year | Tax Paid | Tax Assessment Tax Assessment Total Assessment is a certain percentage of the fair market value that is determined by local assessors to be the total taxable value of land and additions on the property. | Land | Improvement |
|---|---|---|---|---|
| 2024 | $6,575 | $591,923 | $293,149 | $298,774 |
| 2023 | $6,428 | $580,317 | $287,401 | $292,916 |
| 2022 | $6,302 | $568,939 | $281,766 | $287,173 |
| 2021 | $6,126 | $557,784 | $276,241 | $281,543 |
| 2020 | $6,068 | $552,065 | $273,408 | $278,657 |
| 2019 | $5,991 | $541,241 | $268,047 | $273,194 |
| 2018 | $5,899 | $530,629 | $262,791 | $267,838 |
| 2017 | $5,653 | $520,225 | $257,638 | $262,587 |
| 2016 | $5,543 | $510,025 | $252,586 | $257,439 |
| 2015 | $5,470 | $502,364 | $248,791 | $253,573 |
| 2014 | $5,353 | $492,524 | $243,918 | $248,606 |
Source: Public Records
Map
Nearby Homes
- 5946 E Calle Principia
- 5867 E Mountain Loop Trail Unit 11
- 6011 E Montefino Ln
- 735 S Palomino Ln
- 595 S Avenida Faro
- 5625 E Calle Canada
- 566 S Los Coyotes Dr
- 545 S Ranch View Cir Unit 10
- 495 S Ranch View Cir Unit CI1
- 5548 E Vista Del Este
- 113 S Francisco St
- 5548 E Vista Del Rio
- 5407 E Willowick Dr
- 6352 E Nohl Ranch Rd
- 5918 E Camino Manzano
- 6270 E Arboretum Rd
- 6401 E Nohl Ranch Rd Unit 71
- 6070 E Avenida Arbol
- 5286 E Rural Ridge Cir
- 2585 N Falconer Way