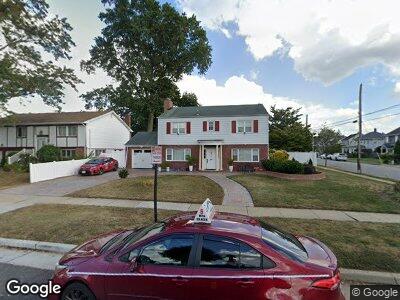
71 Ingraham Blvd Hempstead, NY 11550
Hempstead NeighborhoodEstimated Value: $612,000 - $653,853
3
Beds
3
Baths
2,002
Sq Ft
$316/Sq Ft
Est. Value
About This Home
This home is located at 71 Ingraham Blvd, Hempstead, NY 11550 and is currently estimated at $632,927, approximately $316 per square foot. 71 Ingraham Blvd is a home located in Nassau County with nearby schools including St Martin De Porres Marianist School and Hebrew Academy of Nassau County Middle School and Brookdale High School.
Ownership History
Date
Name
Owned For
Owner Type
Purchase Details
Closed on
Sep 27, 2023
Sold by
Singh Dhanraj M
Bought by
Algoo Nandanie and Rekhiram Akash V
Current Estimated Value
Purchase Details
Closed on
Apr 29, 2021
Sold by
Tsatskis Israel
Bought by
Singh Dhanraj M
Home Financials for this Owner
Home Financials are based on the most recent Mortgage that was taken out on this home.
Original Mortgage
$382,000
Interest Rate
3.1%
Mortgage Type
New Conventional
Purchase Details
Closed on
Jan 18, 2018
Sold by
Noel Jose Julio and Noel Hilda E
Bought by
Tsatskis Israel
Home Financials for this Owner
Home Financials are based on the most recent Mortgage that was taken out on this home.
Original Mortgage
$403,696
Interest Rate
3.94%
Mortgage Type
VA
Create a Home Valuation Report for This Property
The Home Valuation Report is an in-depth analysis detailing your home's value as well as a comparison with similar homes in the area
Home Values in the Area
Average Home Value in this Area
Purchase History
| Date | Buyer | Sale Price | Title Company |
|---|---|---|---|
| Algoo Nandanie | -- | None Available | |
| Algoo Nandanie | -- | None Available | |
| Singh Dhanraj M | $477,500 | First American Title | |
| Singh Dhanraj M | $477,500 | First American Title | |
| Tsatskis Israel | $380,000 | -- | |
| Tsatskis Israel | $380,000 | -- |
Source: Public Records
Mortgage History
| Date | Status | Borrower | Loan Amount |
|---|---|---|---|
| Previous Owner | Singh Dhanraj M | $382,000 | |
| Previous Owner | Tsatskis Israel | $403,696 | |
| Previous Owner | Noel Hilda E | $274,200 | |
| Previous Owner | Noel Jose Julio | $294,675 |
Source: Public Records
Tax History Compared to Growth
Tax History
| Year | Tax Paid | Tax Assessment Tax Assessment Total Assessment is a certain percentage of the fair market value that is determined by local assessors to be the total taxable value of land and additions on the property. | Land | Improvement |
|---|---|---|---|---|
| 2024 | $950 | $382 | $136 | $246 |
| 2023 | $9,538 | $414 | $147 | $267 |
| 2022 | $9,538 | $405 | $147 | $258 |
| 2021 | $12,884 | $380 | $127 | $253 |
| 2020 | $7,982 | $519 | $405 | $114 |
| 2019 | $1,133 | $519 | $380 | $139 |
| 2018 | $832 | $553 | $0 | $0 |
| 2017 | $4,710 | $588 | $304 | $284 |
| 2016 | $5,739 | $784 | $405 | $379 |
| 2015 | $1,313 | $784 | $405 | $379 |
| 2014 | $1,313 | $784 | $405 | $379 |
| 2013 | $1,215 | $784 | $405 | $379 |
Source: Public Records
Map
Nearby Homes
- 83 Ingraham Blvd
- 120 Macdonald St
- 161 Ingraham Blvd
- 676 Front St Unit 2F
- 27 Albemarle Ave
- 23 Elizabeth Ct
- 25-39 Hendrickson Ave
- 57 Thorne Ave
- 49 Perry St
- 505 Fulton Ave Unit 503
- 501 Fulton Ave
- 497 Fulton Ave
- 50 Cameron Ave
- 47 Gladys Ave
- 26 California Ave
- 18 Perry St
- 749 Front St
- 32 Thorne Ave
- 183 Perry St
- 104 Henry St