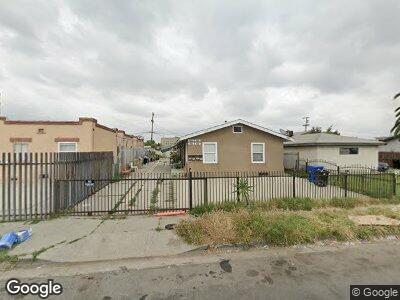
723 W 76th St Los Angeles, CA 90044
Vermont Knolls NeighborhoodEstimated Value: $687,000 - $851,000
4
Beds
4
Baths
2,112
Sq Ft
$359/Sq Ft
Est. Value
About This Home
This home is located at 723 W 76th St, Los Angeles, CA 90044 and is currently estimated at $757,667, approximately $358 per square foot. 723 W 76th St is a home located in Los Angeles County with nearby schools including Loren Miller Elementary School, Mary McLeod Bethune Middle School, and Academy For Multiligual Arts And Science At Mervyn M. Dymally High.
Ownership History
Date
Name
Owned For
Owner Type
Purchase Details
Closed on
Mar 22, 2023
Sold by
Carreno Lopez Lisette Gabriela
Bought by
Lopez Carreno Trust
Current Estimated Value
Purchase Details
Closed on
Jul 10, 2009
Sold by
Lopez Rafael
Bought by
Carreno Lisette G
Purchase Details
Closed on
Jul 8, 2009
Sold by
Wells Fargo Bank Na
Bought by
Carreno Lisette G
Purchase Details
Closed on
Apr 2, 2008
Sold by
Ford Pamela Jo
Bought by
Wells Fargo Bank Na and Option One Mortgage Loan Trust 2007-3 As
Purchase Details
Closed on
Sep 18, 2006
Sold by
Smith Herbert
Bought by
Ford James and Ford Pamela Jo
Home Financials for this Owner
Home Financials are based on the most recent Mortgage that was taken out on this home.
Original Mortgage
$360,000
Interest Rate
8.05%
Mortgage Type
Balloon
Purchase Details
Closed on
Mar 6, 1995
Sold by
Smith Mary Francis
Bought by
Smith Herbert
Create a Home Valuation Report for This Property
The Home Valuation Report is an in-depth analysis detailing your home's value as well as a comparison with similar homes in the area
Home Values in the Area
Average Home Value in this Area
Purchase History
| Date | Buyer | Sale Price | Title Company |
|---|---|---|---|
| Lopez Carreno Trust | -- | -- | |
| Carreno Lisette G | -- | First American Title Ins Co | |
| Carreno Lisette G | $136,500 | First American Title Ins Co | |
| Wells Fargo Bank Na | $392,481 | None Available | |
| Ford James | $450,000 | Advantage Title | |
| Smith Herbert | -- | -- |
Source: Public Records
Mortgage History
| Date | Status | Borrower | Loan Amount |
|---|---|---|---|
| Previous Owner | Carreno Lisette G | $224,700 | |
| Previous Owner | Ford James | $360,000 |
Source: Public Records
Tax History Compared to Growth
Tax History
| Year | Tax Paid | Tax Assessment Tax Assessment Total Assessment is a certain percentage of the fair market value that is determined by local assessors to be the total taxable value of land and additions on the property. | Land | Improvement |
|---|---|---|---|---|
| 2024 | $4,319 | $316,362 | $253,094 | $63,268 |
| 2023 | $4,248 | $310,160 | $248,132 | $62,028 |
| 2022 | $4,070 | $304,079 | $243,267 | $60,812 |
| 2021 | $4,010 | $298,118 | $238,498 | $59,620 |
| 2019 | $3,902 | $289,637 | $231,425 | $58,212 |
| 2018 | $3,751 | $283,966 | $226,888 | $57,078 |
| 2017 | $3,676 | $278,046 | $222,440 | $55,606 |
| 2016 | $3,576 | $272,595 | $218,079 | $54,516 |
| 2015 | $3,528 | $268,502 | $214,804 | $53,698 |
| 2014 | $3,568 | $263,244 | $210,597 | $52,647 |
Source: Public Records
Map
Nearby Homes